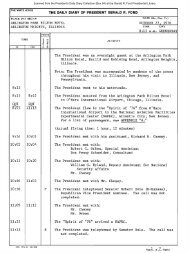
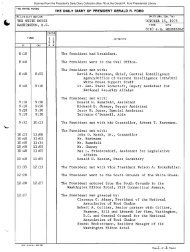
October 31, 1975 - Gerald R. Ford Presidential Library and Museum
October 31, 1975 - Gerald R. Ford Presidential Library and Museum
October 31, 1975 - Gerald R. Ford Presidential Library and Museum
You also want an ePaper? Increase the reach of your titles
YUMPU automatically turns print PDFs into web optimized ePapers that Google loves.
elating residuals versus shift factors to determine the statistical<br />
best shift while the contractor used a trial <strong>and</strong> error converging<br />
iteration to determine the unknown constant.<br />
The hyperbolic decline program was tested against known test data<br />
which ensured accuracy of the program. Calculations on portions of<br />
actual data followed <strong>and</strong> the results were examined to ensure proper<br />
execution of the program.<br />
Reserves. Once a declining trend was established by the curve fit<br />
routine, reserves to the economic limit were calculated by summing the<br />
volumes under the curve.<br />
Data Screens. Certain situations were encountered where decline curve<br />
evaluation was rejected for analysis. These are listed below:<br />
Situation Screen<br />
1. No production reported in 1973 production greater than<br />
most recent year. zero.<br />
2. Production not declining. Three-year running average.<br />
3. Less than 4 points to Three-year running average.<br />
determine curve.<br />
4. Confidence level of 95 Table of values for 95 percent<br />
percent not met. confidence level.<br />
5. Projected production declined Slope less than 0.02.<br />
less than a 2 percent rate.<br />
6. Calculated reserves greater Reserves 25 times greater than<br />
than 25 times the latest 1973 production.<br />
year's production.<br />
Evaluation<br />
The expertise gained from the decline curve analysis has revealed<br />
certain shortcomings in applying a computer program to rapidly process<br />
field data for determining reserves.<br />
The production input data (number of producing wells <strong>and</strong> unimpeded<br />
production rates) must be accurate or the results will be faulty.<br />
Arbitrary ab<strong>and</strong>onment rates based only on depth are not realistically<br />
valid. The economic ab<strong>and</strong>onment rate for each field at the same<br />
depth can vary widely because of surface operating cost differences.<br />
For example. in Pennsylvania some wells are still producing at averages<br />
of less than 1/2 barrel per day while wells in the Alaskan Cook Inlet<br />
60


