- Page 1 and 2:
Exterior Lighting 2012/2013 Electri
- Page 3 and 4:
Innovation 2012/2013 The technical
- Page 5 and 6:
244 Ground-recessed uplighters 20 W
- Page 7 and 8:
Lighting Design: Speirs+Major Assoc
- Page 9 and 10:
Lighting Design: Ulrike Brandi Lich
- Page 11 and 12:
Lighting Design: a g Licht, Bonn Ar
- Page 13 and 14:
Lighting Design: Point of View, Mel
- Page 15 and 16:
Lighting Design: George Sexton Asso
- Page 17 and 18:
Lighting Design: Ljusarkitektur AB,
- Page 19 and 20:
Lighting Design: Lisys Lighting Sys
- Page 21 and 22:
Interesting lighting effects can be
- Page 23 and 24:
50 77 93 Accessories for Arclight P
- Page 25 and 26:
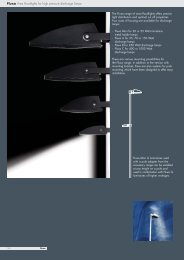
The Nightfocus range offers precise
- Page 27 and 28:
Nightfocus Rotationally symmetrical
- Page 29 and 30:
Nightfocus LED With 5 x 1 W high pe
- Page 31 and 32:
General Electric CMH 35 W Osram HCI
- Page 33 and 34:
1.1 1.2 1.3 2.1 2.2 2.3 3.1 3.2 3.3
- Page 35 and 36:
Nightfocus is a versatile luminaire
- Page 37 and 38:
Design: Roy Fleetwood In the versio
- Page 39 and 40:
90 90 90 60 1000 1500 30 100 200 30
- Page 41 and 42:
90 90 90 60 1000 1500 30 100 200 30
- Page 43 and 44:
3 5 8 3 21 9 8 4 21 40 48 38 64 8,5
- Page 45 and 46:
Nightvision LSM Modular System (T16
- Page 47 and 48:
Nightvision LSL Modular System (LED
- Page 49 and 50:
Nightvision LSR Modular System (LED
- Page 51 and 52:
0 4 0 9 79 Accessories for Nightvis
- Page 53 and 54:
57 mm The versions with LEDs have a
- Page 55 and 56:
90 90 1000 1500 2000 1000 1500 2000
- Page 57 and 58:
90 90 1000 1500 2000 1000 1500 2000
- Page 59 and 60:
The Modular System Luminaires of di
- Page 61 and 62:
Ecoline SM Modular System (T16), mi
- Page 63 and 64:
Ecoline SL Modular System (LED), le
- Page 65 and 66:
Ecoline SR Modular System (LED), ri
- Page 67 and 68:
Luminaires with a wall washer distr
- Page 69 and 70:
Nightvision Mini Wall washer with m
- Page 71 and 72:
Nightvision Mini Rotationally symme
- Page 73 and 74:
Nightvision Wall washer For ceramic
- Page 75 and 76:
Nightvision Asymmetrical wide beam
- Page 77 and 78:
Nightvision Rotationally symmetrica
- Page 79 and 80:
Precise optics and a shallow housin
- Page 81 and 82:
Ecovision Mini Wall washer with wal
- Page 83 and 84:
Ecovision Wall washer with wall arm
- Page 85 and 86:
The range of accessories for the Ni
- Page 87 and 88:
Accessories for Nightscape floodlig
- Page 89 and 90:
Rotationally symmetrical reflectors
- Page 91 and 92:
Nightscape A Axially symmetrical Fo
- Page 93 and 94:
Nightscape B For compact fluorescen
- Page 95 and 96:
Nightscape B, 250 W Rotationally sy
- Page 97 and 98:
Nightscape B, 400 W Rotationally sy
- Page 99 and 100:
Accessories such as louvres and spe
- Page 101 and 102:
Thanks to their small dimensions, t
- Page 103 and 104:
24 104 70 60 82 50 7 30 50 220 200
- Page 105 and 106:
Superlight Compact Micro RGB Equipp
- Page 107 and 108:
After maintenance without Light Loc
- Page 109 and 110:
Superlight Compact Mini Asymmetrica
- Page 111 and 112:
20 4 8 88 104 70 0 4 4 2 1 5 1 1 50
- Page 113 and 114:
Superlight Compact S Asymmetrical w
- Page 115 and 116:
9 9 9 9 5 1 1 0 4 115 115 90 70 300
- Page 117 and 118:
Superlight Compact Asymmetrical wid
- Page 119 and 120:
Superlight Compact Rotationally sym
- Page 121 and 122:
Superlight Compact LED With 10 x 3
- Page 123 and 124:
0 6 1 R 3/8” 77 100 Accessories f
- Page 125 and 126:
117 116 117 150 150 150 30 30 20 Ac
- Page 127 and 128:
The BFI Imax Cinema is located in t
- Page 129 and 130:
Superlight 150 W Rotationally symme
- Page 131 and 132:
Superlight 150/250 W Axially symmet
- Page 133 and 134:
Superlight 250 W Rotationally symme
- Page 135 and 136:
Superlight 400 W Axially symmetrica
- Page 137 and 138:
Superlight 250/400 W Asymmetrical,
- Page 139 and 140:
Accessories for floodlights Superli
- Page 141 and 142:
Superlight 1000 W Rotationally symm
- Page 143 and 144:
This range of floodlights which is
- Page 145 and 146:
LED floodlights Sensorlight with PI
- Page 147 and 148:
The range of halogen floodlights se
- Page 149 and 150:
0 4 90 70 M8 0 5 3 Accessories for
- Page 151 and 152:
Accessories for halogen floodlights
- Page 153 and 154:
Accessories for halogen floodlights
- Page 155 and 156:
Accessories for halogen floodlights
- Page 157 and 158:
Halogen floodlight for low voltage
- Page 159 and 160:
Halogen floodlights 500 W Sensorlig
- Page 161 and 162:
The extremely narrow beam distribut
- Page 163 and 164:
24 80 58 95 6,5 82 7 30 50 80 250 2
- Page 165 and 166:
24 100 58 95 6,5 82 7 30 50 100 250
- Page 167 and 168:
Lighting consultants Speirs and Maj
- Page 169 and 170:
Prondo A with wall arm For low volt
- Page 171 and 172:
Prondo B with wall arm For low volt
- Page 173 and 174:
Prondo C with wall arm For compact
- Page 175 and 176:
0 4 90 70 M8 0 5 3 All exterior par
- Page 177 and 178:
0 4 90 70 M8 0 5 3 The installation
- Page 179 and 180:
Nightspot A is also available as a
- Page 181 and 182:
Nightspot A, wide beam For ceramic
- Page 183 and 184:
Nightspot A with wall arm, wide bea
- Page 185 and 186:
Nightspot A with earth spike, wide
- Page 187 and 188:
Nightspot A LED Equipped with 3 x 3
- Page 189 and 190:
Nightspot A LED with earth spike Eq
- Page 191 and 192:
Nightspot A Gobo Projector For cera
- Page 193 and 194:
Nightspot gobo projectors are desig
- Page 195 and 196:
Nightspot B with mounting base For
- Page 197 and 198:
Nightspot B LED with mounting base
- Page 199 and 200:
Diameter of image in m Diameter of
- Page 201 and 202:
Nightspot B2, with mounting base (P
- Page 203 and 204:
Nightspot C with mounting base For
- Page 205 and 206:
200 218 265 13 13 13 Accessories fo
- Page 207 and 208:
Nightspot pole luminaires can be us
- Page 209 and 210:
Nightspot B LED, pole luminaire Wit
- Page 211 and 212:
Diameter of image in m Diameter of
- Page 213 and 214:
Nightspot B2, pole luminaire, wide
- Page 215 and 216:
160 170 203 223 175 271 Accessories
- Page 217 and 218:
Fluxa Mini For ceramic metal halide
- Page 219 and 220:
Fluxa Mini G For ceramic metal hali
- Page 221 and 222:
0 2 5 6 9 9 5 6 3 0 1 95 50 78 95 5
- Page 223 and 224:
Fluxa A, wide beam For metal halide
- Page 225 and 226:
Fluxa B For metal halide lamps (HIT
- Page 227 and 228:
Fluxa C For metal halide lamps (HIT
- Page 229 and 230:
Fluxa AG For metal halide lamps (HI
- Page 231 and 232:
Fluxa AG LED, wide beam With high p
- Page 233 and 234:
Fluxa BG LED, wide beam With high p
- Page 235 and 236:
Fluxa BGU Uplight For metal halide
- Page 237 and 238:
Fluxa A - with arm, wide beam For m
- Page 239 and 240:
Fluxa B - with arm For metal halide
- Page 241 and 242:
Fluxa C - with arm For metal halide
- Page 243 and 244:
Post top luminaire For compact fluo
- Page 245 and 246:
Pole top adapters for one, two or t
- Page 247 and 248:
HIT-TC-CE 20 W adjustible optics 5
- Page 249 and 250:
Part number Colour Description 126
- Page 251 and 252:
LED ground-recessed uplighters adju
- Page 253 and 254:
Ground-recessed uplighters Rotation
- Page 255 and 256:
Accessories for ground-recessed upl
- Page 257 and 258:
LED ground-recessed uplighters adju
- Page 259 and 260:
274 280 1 3 2 6 3 2 129 125 129 6 2
- Page 261 and 262:
70 W 150 W 70 W 150 W 70 W 150 W Ac
- Page 263 and 264:
Accessories for ground-recessed upl
- Page 265 and 266:
Ground-recessed luminaires with asy
- Page 267 and 268:
Ground-recessed uplighters Asymmetr
- Page 269 and 270:
Ground-recessed uplighters Wall was
- Page 271 and 272:
The luminaires are locked into the
- Page 273 and 274:
Dockland Hamburg Architecture: BRT
- Page 275 and 276:
0 4 0 9 79 Lamps, Light source (see
- Page 277 and 278:
Ground-recessed luminaires Single l
- Page 279 and 280:
0 4 0 9 79 Lamps, Light source (see
- Page 281 and 282:
Accessories for single- and extensi
- Page 283 and 284:
The trim ring needs no screws and c
- Page 285 and 286:
Ceiling-recessed downlights with co
- Page 287 and 288:
Ceiling-recessed downlights with co
- Page 289 and 290:
Ceiling-recessed downlights with co
- Page 291 and 292:
Ceiling-recessed downlights with co
- Page 293 and 294:
Ceiling-recessed downlights with co
- Page 295 and 296:
Ceiling-recessed LED downlights wit
- Page 297 and 298:
22 70 70 70 70 Accessories for rece
- Page 299 and 300:
Surface-mounted downlight Narrow be
- Page 301 and 302:
Surface-mounted downlight Wide beam
- Page 303 and 304:
Surface-mounted downlight Gimbal mo
- Page 305 and 306:
Surface-mounted LED downlight Gimba
- Page 307 and 308:
22 70 70 70 70 Accessories for surf
- Page 309 and 310:
In outdoor areas the recommendation
- Page 311 and 312:
Nightpath Bollard For ceramic metal
- Page 313 and 314:
Nightline is a range of luminaires
- Page 315 and 316:
Nightline A with wall arm For compa
- Page 317 and 318:
Nightline B with joint For compact
- Page 319 and 320: Nightline B with joint For metal ha
- Page 321 and 322: Nightline B with wall arm and 2 joi
- Page 323 and 324: Nightline BG with joint ceiling mou
- Page 325 and 326: The slim cross section blends in di
- Page 327 and 328: 90 100 200 300 I (cd/klm) 90 Lamps
- Page 329 and 330: 90 100 200 300 I (cd/klm) 90 0,3 m
- Page 331 and 332: The Modular System Luminaires of di
- Page 333 and 334: Nightline LSM Modular System, middl
- Page 335 and 336: If modules of the same length are t
- Page 337 and 338: Twin EL A - LED With high performan
- Page 339 and 340: Twin EL A - HIT For ceramic metal h
- Page 341 and 342: Twin EL C For ceramic metal halide
- Page 343 and 344: Superlight Twin For ceramic metal h
- Page 345 and 346: Prismat H For compact fluorescent l
- Page 347 and 348: Prismat S For compact fluorescent l
- Page 349 and 350: Variant A For compact fluorescent l
- Page 351 and 352: Variant W/B For compact fluorescent
- Page 353 and 354: Facette B and C with more powerful
- Page 355 and 356: Facette W For compact fluorescent l
- Page 357 and 358: Facette C For compact fluorescent l
- Page 359 and 360: Superlight 18 W with wall box and j
- Page 361 and 362: Superlight 18 W with wall arm and t
- Page 363 and 364: Superlight 24 W For compact fluores
- Page 365 and 366: Protection and Test Marks - Electro
- Page 367 and 368: High Pressure Sodium Vapour Lamps -
- Page 369: The luminaire efficency ( LB ) is a