QS Investors Diversification Based Investing Whitepaper - FTSE
QS Investors Diversification Based Investing Whitepaper - FTSE
QS Investors Diversification Based Investing Whitepaper - FTSE

Create successful ePaper yourself
Turn your PDF publications into a flip-book with our unique Google optimized e-Paper software.
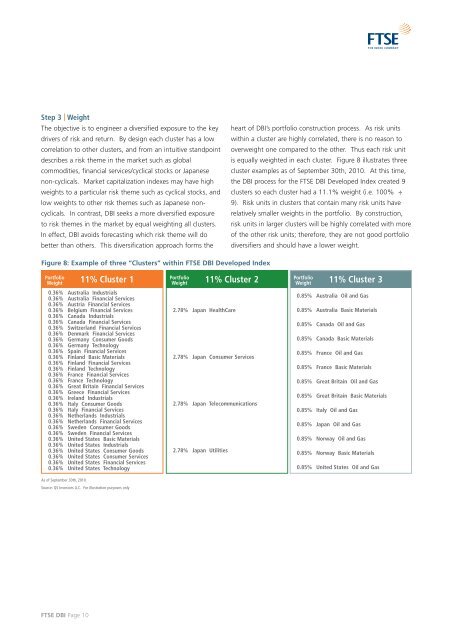
Step 3 | Weight<br />
The objective is to engineer a diversified exposure to the key<br />
drivers of risk and return. By design each cluster has a low<br />
correlation to other clusters, and from an intuitive standpoint<br />
describes a risk theme in the market such as global<br />
commodities, financial services/cyclical stocks or Japanese<br />
non-cyclicals. Market capitalization indexes may have high<br />
weights to a particular risk theme such as cyclical stocks, and<br />
low weights to other risk themes such as Japanese noncyclicals.<br />
In contrast, DBI seeks a more diversified exposure<br />
to risk themes in the market by equal weighting all clusters.<br />
In effect, DBI avoids forecasting which risk theme will do<br />
better than others. This diversification approach forms the<br />
Figure 8: Example of three “Clusters” within <strong>FTSE</strong> DBI Developed Index<br />
Portfolio<br />
Weight<br />
As of September 30th, 2010.<br />
Source: <strong>QS</strong> <strong>Investors</strong> LLC. For illustration purposes only<br />
<strong>FTSE</strong> DBI Page 10<br />
11% Cluster 1<br />
0.36% Australia Industrials<br />
0.36% Australia Financial Services<br />
0.36% Austria Financial Services<br />
0.36% Belgium Financial Services<br />
0.36% Canada Industrials<br />
0.36% Canada Financial Services<br />
0.36% Switzerland Financial Services<br />
0.36% Denmark Financial Services<br />
0.36% Germany Consumer Goods<br />
0.36% Germany Technology<br />
0.36% Spain Financial Services<br />
0.36% Finland Basic Materials<br />
0.36% Finland Financial Services<br />
0.36% Finland Technology<br />
0.36% France Financial Services<br />
0.36% France Technology<br />
0.36% Great Britain Financial Services<br />
0.36% Greece Financial Services<br />
0.36% Ireland Industrials<br />
0.36% Italy Consumer Goods<br />
0.36% Italy Financial Services<br />
0.36% Netherlands Industrials<br />
0.36% Netherlands Financial Services<br />
0.36% Sweden Consumer Goods<br />
0.36% Sweden Financial Services<br />
0.36% United States Basic Materials<br />
0.36% United States Industrials<br />
0.36% United States Consumer Goods<br />
0.36% United States Consumer Services<br />
0.36% United States Financial Services<br />
0.36% United States Technology<br />
Portfolio<br />
Weight<br />
heart of DBI’s portfolio construction process. As risk units<br />
within a cluster are highly correlated, there is no reason to<br />
overweight one compared to the other. Thus each risk unit<br />
is equally weighted in each cluster. Figure 8 illustrates three<br />
cluster examples as of September 30th, 2010. At this time,<br />
the DBI process for the <strong>FTSE</strong> DBI Developed Index created 9<br />
clusters so each cluster had a 11.1% weight (i.e. 100% ÷<br />
9). Risk units in clusters that contain many risk units have<br />
relatively smaller weights in the portfolio. By construction,<br />
risk units in larger clusters will be highly correlated with more<br />
of the other risk units; therefore, they are not good portfolio<br />
diversifiers and should have a lower weight.<br />
11% Cluster 2<br />
2.78% Japan HealthCare<br />
2.78% Japan Consumer Services<br />
2.78% Japan Telecommunications<br />
2.78% Japan Utilities<br />
Portfolio<br />
Weight<br />
11% Cluster 3<br />
0.85% Australia Oil and Gas<br />
0.85% Australia Basic Materials<br />
0.85% Canada Oil and Gas<br />
0.85% Canada Basic Materials<br />
0.85% France Oil and Gas<br />
0.85% France Basic Materials<br />
0.85% Great Britain Oil and Gas<br />
0.85% Great Britain Basic Materials<br />
0.85% Italy Oil and Gas<br />
0.85% Japan Oil and Gas<br />
0.85% Norway Oil and Gas<br />
0.85% Norway Basic Materials<br />
0.85% United States Oil and Gas