QS Investors Diversification Based Investing Whitepaper - FTSE
QS Investors Diversification Based Investing Whitepaper - FTSE
QS Investors Diversification Based Investing Whitepaper - FTSE

You also want an ePaper? Increase the reach of your titles
YUMPU automatically turns print PDFs into web optimized ePapers that Google loves.
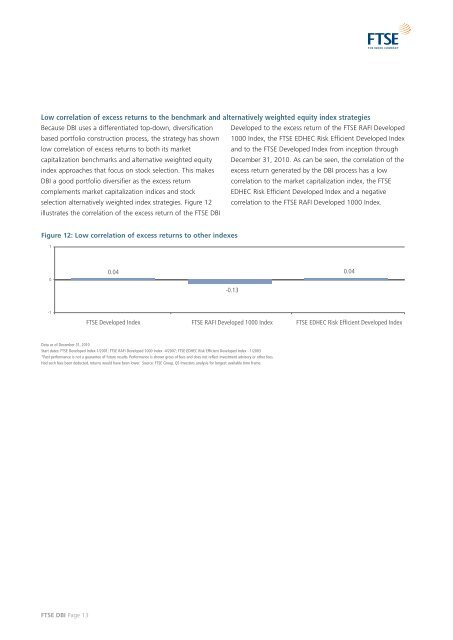
Low correlation of excess returns to the benchmark and alternatively weighted equity index strategies<br />
Because DBI uses a differentiated top-down, diversification<br />
based portfolio construction process, the strategy has shown<br />
low correlation of excess returns to both its market<br />
capitalization benchmarks and alternative weighted equity<br />
index approaches that focus on stock selection. This makes<br />
DBI a good portfolio diversifier as the excess return<br />
complements market capitalization indices and stock<br />
selection alternatively weighted index strategies. Figure 12<br />
illustrates the correlation of the excess return of the <strong>FTSE</strong> DBI<br />
Figure 12: Low correlation of excess returns to other indexes<br />
1<br />
0<br />
-1<br />
Visa IPO on<br />
19/03/2008<br />
Data as of December 31, 2010<br />
Start dates: <strong>FTSE</strong> Developed Index-1/2001; <strong>FTSE</strong> RAFI Developed 1000 Index -4/2007; <strong>FTSE</strong> EDHEC Risk Efficient Developed Index - 1/2003<br />
*Past performance is not a guarantee of future results. Performance is shown gross of fees and does not reflect investment advisory or other fees.<br />
Had such fees been deducted, returns would have been lower. Source: <strong>FTSE</strong> Group, <strong>QS</strong> <strong>Investors</strong> analysis for longest available time frame.<br />
<strong>FTSE</strong> DBI Page 13<br />
0.04<br />
<strong>FTSE</strong> Developed Index<br />
Developed to the excess return of the <strong>FTSE</strong> RAFI Developed<br />
1000 Index, the <strong>FTSE</strong> EDHEC Risk Efficient Developed Index<br />
and to the <strong>FTSE</strong> Developed Index from inception through<br />
December 31, 2010. As can be seen, the correlation of the<br />
excess return generated by the DBI process has a low<br />
correlation to the market capitalization index, the <strong>FTSE</strong><br />
EDHEC Risk Efficient Developed Index and a negative<br />
correlation to the <strong>FTSE</strong> RAFI Developed 1000 Index.<br />
-0.13<br />
<strong>FTSE</strong> RAFI Developed 1000 Index<br />
0.04<br />
<strong>FTSE</strong> EDHEC Risk Efficient Developed Index