QS Investors Diversification Based Investing Whitepaper - FTSE
QS Investors Diversification Based Investing Whitepaper - FTSE
QS Investors Diversification Based Investing Whitepaper - FTSE

Create successful ePaper yourself
Turn your PDF publications into a flip-book with our unique Google optimized e-Paper software.
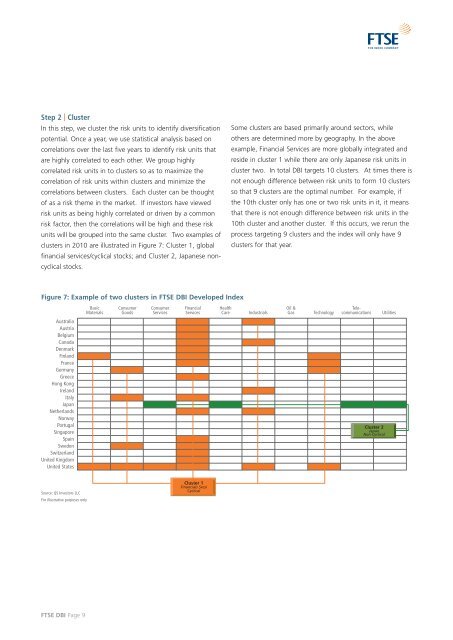
Step 2 | Cluster<br />
In this step, we cluster the risk units to identify diversification<br />
potential. Once a year, we use statistical analysis based on<br />
correlations over the last five years to identify risk units that<br />
are highly correlated to each other. We group highly<br />
correlated risk units in to clusters so as to maximize the<br />
correlation of risk units within clusters and minimize the<br />
correlations between clusters. Each cluster can be thought<br />
of as a risk theme in the market. If investors have viewed<br />
risk units as being highly correlated or driven by a common<br />
risk factor, then the correlations will be high and these risk<br />
units will be grouped into the same cluster. Two examples of<br />
clusters in 2010 are illustrated in Figure 7: Cluster 1, global<br />
financial services/cyclical stocks; and Cluster 2, Japanese noncyclical<br />
stocks.<br />
Figure 7: Example of two clusters in <strong>FTSE</strong> DBI Developed Index<br />
Australia<br />
Austria<br />
Belgium<br />
Canada<br />
Denmark<br />
Finland<br />
France<br />
Germany<br />
Greece<br />
Hong Kong<br />
Ireland<br />
Italy<br />
Japan<br />
Netherlands<br />
Norway<br />
Portugal<br />
Singapore<br />
Spain<br />
Sweden<br />
Switzerland<br />
United Kingdom<br />
United States<br />
Source: <strong>QS</strong> <strong>Investors</strong> LLC<br />
For illustrative purposes only<br />
<strong>FTSE</strong> DBI Page 9<br />
Basic<br />
Materials<br />
Consumer<br />
Goods<br />
Consumer<br />
Services<br />
Financial<br />
Services<br />
Cluster 1<br />
Financials Svcs/<br />
Cyclical<br />
Some clusters are based primarily around sectors, while<br />
others are determined more by geography. In the above<br />
example, Financial Services are more globally integrated and<br />
reside in cluster 1 while there are only Japanese risk units in<br />
cluster two. In total DBI targets 10 clusters. At times there is<br />
not enough difference between risk units to form 10 clusters<br />
so that 9 clusters are the optimal number. For example, if<br />
the 10th cluster only has one or two risk units in it, it means<br />
that there is not enough difference between risk units in the<br />
10th cluster and another cluster. If this occurs, we rerun the<br />
process targeting 9 clusters and the index will only have 9<br />
clusters for that year.<br />
Health<br />
Care Industrials<br />
Oil &<br />
Gas Technology<br />
Telecommunications<br />
Utilities<br />
Cluster 2<br />
Japan<br />
Non Cyclical