QS Investors Diversification Based Investing Whitepaper - FTSE
QS Investors Diversification Based Investing Whitepaper - FTSE
QS Investors Diversification Based Investing Whitepaper - FTSE

Create successful ePaper yourself
Turn your PDF publications into a flip-book with our unique Google optimized e-Paper software.
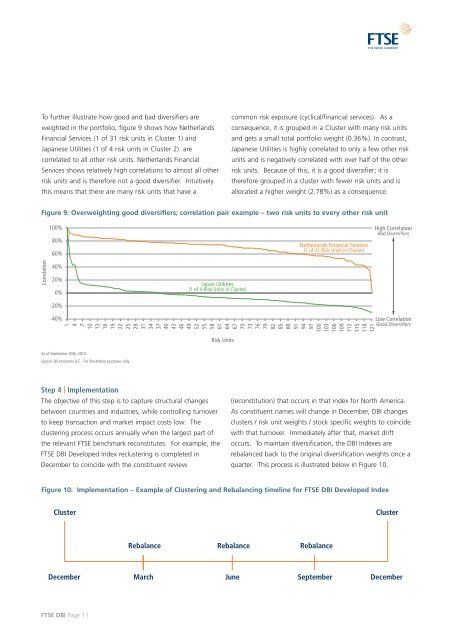
To further illustrate how good and bad diversifiers are<br />
weighted in the portfolio, figure 9 shows how Netherlands<br />
Financial Services (1 of 31 risk units in Cluster 1) and<br />
Japanese Utilities (1 of 4 risk units in Cluster 2) are<br />
correlated to all other risk units. Netherlands Financial<br />
Services shows relatively high correlations to almost all other<br />
risk units and is therefore not a good diversifier. Intuitively<br />
this means that there are many risk units that have a<br />
Correlation<br />
100%<br />
80%<br />
60%<br />
40%<br />
20%<br />
0%<br />
-20%<br />
-40%<br />
Step 4 | Implementation<br />
The objective of this step is to capture structural changes<br />
between countries and industries, while controlling turnover<br />
to keep transaction and market impact costs low. The<br />
clustering process occurs annually when the largest part of<br />
the relevant <strong>FTSE</strong> benchmark reconstitutes. For example, the<br />
<strong>FTSE</strong> DBI Developed Index reclustering is completed in<br />
December to coincide with the constituent review<br />
<strong>FTSE</strong> DBI Page 11<br />
Risk Units<br />
common risk exposure (cyclical/financial services). As a<br />
consequence, it is grouped in a Cluster with many risk units<br />
and gets a small total portfolio weight (0.36%). In contrast,<br />
Japanese Utilities is highly correlated to only a few other risk<br />
units and is negatively correlated with over half of the other<br />
risk units. Because of this, it is a good diversifier; it is<br />
therefore grouped in a cluster with fewer risk units and is<br />
allocated a higher weight (2.78%) as a consequence.<br />
Figure 9: Overweighting good diversifiers; correlation pair example – two risk units to every other risk unit<br />
Japan Utilities<br />
(1 of 4 Risk Units in Cluster)<br />
Netherlands Financial Services<br />
(1 of 31 Risk Units in Cluster)<br />
1<br />
4<br />
7<br />
10<br />
13<br />
16<br />
19<br />
22<br />
25<br />
28<br />
31<br />
34<br />
37<br />
40<br />
43<br />
46<br />
49<br />
52<br />
55<br />
58<br />
61<br />
64<br />
67<br />
70<br />
73<br />
76<br />
79<br />
82<br />
85<br />
88<br />
91<br />
94<br />
97<br />
100<br />
103<br />
106<br />
109<br />
112<br />
115<br />
118<br />
121<br />
As of September 30th, 2010.<br />
Source: <strong>QS</strong> <strong>Investors</strong> LLC. For illustration purposes only<br />
High Correlation<br />
Bad Diversifiers<br />
Low Correlation<br />
Good Diversifiers<br />
(reconstitution) that occurs in that index for North America.<br />
As constituent names will change in December, DBI changes<br />
clusters / risk unit weights / stock specific weights to coincide<br />
with that turnover. Immediately after that, market drift<br />
occurs. To maintain diversification, the DBI Indexes are<br />
rebalanced back to the original diversification weights once a<br />
quarter. This process is illustrated below in Figure 10.<br />
Figure 10: Implementation – Example of Clustering and Rebalancing timeline for <strong>FTSE</strong> DBI Developed Index<br />
Cluster<br />
Rebalance Rebalance Rebalance<br />
Cluster<br />
December March June September December