Technologies for intensification in SW Uganda ... - Foodnet - cgiar
Technologies for intensification in SW Uganda ... - Foodnet - cgiar
Technologies for intensification in SW Uganda ... - Foodnet - cgiar

You also want an ePaper? Increase the reach of your titles
YUMPU automatically turns print PDFs into web optimized ePapers that Google loves.
Wood products from <strong>for</strong>ests, plantations, private woodlots and agro<strong>for</strong>estry <strong>for</strong>m an <strong>in</strong>tegral part<br />
of the farm<strong>in</strong>g systems as e.g. stakes <strong>for</strong> climb<strong>in</strong>g beans, support <strong>for</strong> banana stems, trell<strong>in</strong>g<br />
systems <strong>for</strong> passion fruits and vanilla, and firewood <strong>for</strong> cur<strong>in</strong>g tea. Furthermore, preparation of<br />
food still depends to over 95% on fuelwood and construction of traditional houses depends to a<br />
large extent on poles. In all areas, farmers and local leaders express concern about the dw<strong>in</strong>dl<strong>in</strong>g<br />
wood resources and / or their high prices. In<strong>for</strong>mation about the non-wood products from <strong>for</strong>ests<br />
rema<strong>in</strong>s scarce. However, a study commissioned by the Forest Secretariat will generate more<br />
<strong>in</strong><strong>for</strong>mation on the use and value of <strong>for</strong>est products.<br />
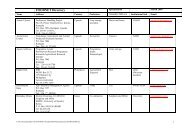
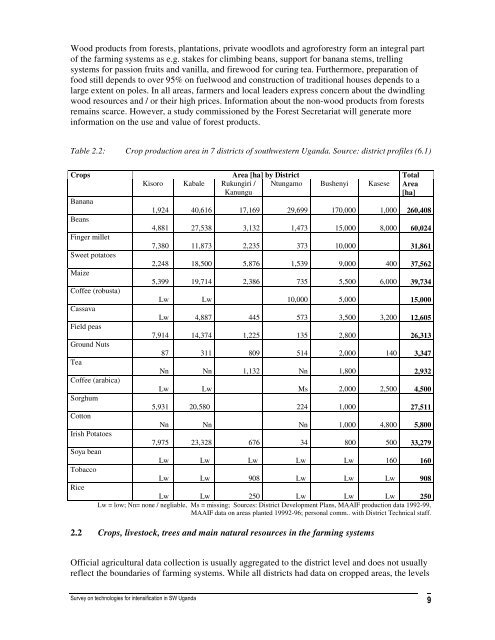
Table 2.2: Crop production area <strong>in</strong> 7 districts of southwestern <strong>Uganda</strong>. Source: district profiles (6.1)<br />
Crops Area [ha] by District Total<br />
Banana<br />
Beans<br />
F<strong>in</strong>ger millet<br />
Sweet potatoes<br />
Maize<br />
Coffee (robusta)<br />
Cassava<br />
Field peas<br />
Ground Nuts<br />
Tea<br />
Coffee (arabica)<br />
Sorghum<br />
Cotton<br />
Irish Potatoes<br />
Soya bean<br />
Tobacco<br />
Rice<br />
Kisoro Kabale Rukungiri /<br />
Kanungu<br />
Ntungamo Bushenyi Kasese Area<br />
[ha]<br />
1,924 40,616 17,169 29,699 170,000 1,000<br />
4,881 27,538 3,132 1,473 15,000 8,000<br />
7,380 11,873 2,235 373 10,000<br />
2,248 18,500 5,876 1,539 9,000 400<br />
5,399 19,714 2,386 735 5,500 6,000<br />
Lw Lw 10,000 5,000<br />
Lw 4,887 445 573 3,500 3,200<br />
7,914 14,374 1,225 135 2,800<br />
87 311 809 514 2,000 140<br />
Nn Nn 1,132 Nn 1,800<br />
Lw Lw Ms 2,000 2,500<br />
5,931 20,580 224 1,000<br />
Nn Nn Nn 1,000 4,800<br />
7,975 23,328 676 34 800 500<br />
Lw Lw Lw Lw Lw 160<br />
Lw Lw 908 Lw Lw Lw<br />
260,408<br />
60,024<br />
31,861<br />
37,562<br />
39,734<br />
15,000<br />
12,605<br />
26,313<br />
3,347<br />
2,932<br />
4,500<br />
27,511<br />
5,800<br />
33,279<br />
Lw Lw 250 Lw Lw Lw 250<br />
Lw = low; Nn= none / negliable, Ms = miss<strong>in</strong>g; Sources: District Development Plans, MAAIF production data 1992-99,<br />
MAAIF data on areas planted 19992-96; personal comm.. with District Technical staff.<br />
2.2 Crops, livestock, trees and ma<strong>in</strong> natural resources <strong>in</strong> the farm<strong>in</strong>g systems<br />
Official agricultural data collection is usually aggregated to the district level and does not usually<br />
reflect the boundaries of farm<strong>in</strong>g systems. While all districts had data on cropped areas, the levels<br />
160<br />
908