- Page 1 and 2: FLUID-PARTICLE TRANSPORT DYNAMICS O
- Page 3 and 4: SYNOPSIS The local dynamics of sand
- Page 5 and 6: TABLE OF CONTENTS LIST OF FIGURES C
- Page 7 and 8: CHAPTER 3: JETTING EXPERIMENTS Summ
- Page 9 and 10: 2 Numerical scheme 6-5 3 Results 6-
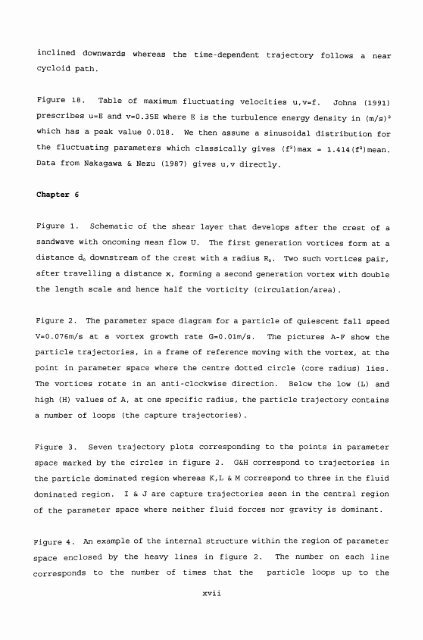
- Page 11 and 12: LIST OF FIGURES Chapter 1 Figure 1.
- Page 13 and 14: U=830mm/s. Figure 16. Thomas et al
- Page 15 and 16: in the boundary layer. a) The forma
- Page 17 and 18: Chapter 3 Figure 1. After Alien (19
- Page 19 and 20: at various values of U/V from 2.7 t
- Page 21 and 22: y Coanda-flapping of the free shear
- Page 23 and 24: of a sandwave crest in the estuary
- Page 25: Figure 7h-i. The temporal fluctuati
- Page 29 and 30: starting position (X,Y) at zero ini
- Page 31 and 32: d Sand grain diameter (m) Fi Number
- Page 33 and 34: G Vortex core growth rate (tn/s) ki
- Page 35 and 36: 1 INTRODUCTION Sand forms the botto
- Page 37 and 38: where U is the depth-averaged veloc
- Page 39 and 40: The wavelengths of dunes primarily
- Page 41 and 42: detached and then confined within a
- Page 43 and 44: The vortex radius rn and apparent w
- Page 45 and 46: Recent work by Nezu & Nakagawa (199
- Page 47 and 48: found in the outer streaks. 4 MODEL
- Page 49 and 50: (1987), for example, modelled gas-s
- Page 51 and 52: Profiles of shear stress and turbul
- Page 53 and 54: 6ft v "' ' Re In the limit of large
- Page 55 and 56: that the particle radius was much s
- Page 57 and 58: and travels downstream at speed }*U
- Page 59 and 60: capture by transient large eddies s
- Page 61 and 62: Chapter 1 Figure 3. Alien (1984). L
- Page 63 and 64: Chapter 1 10 8 e 4 I 08 •- 02 Yal
- Page 65 and 66: Chapter 1 bw speed fluid Figure 11.
- Page 67 and 68: Chapter 1 Figure 16. Thomas et al (
- Page 69 and 70: Chapter 1 StCMl STRESS SCALE « K /
- Page 71 and 72: Chapter 1 Haiht Vdodty Figure 22. S
- Page 73 and 74: Chapter 1 Time = 1.2 2.4 ' ' :•
- Page 75 and 76: 1 INTRODUCTION AND DESIGN CONSIDERA
- Page 77 and 78:
Initial costing for a flume of the
- Page 79 and 80:
flanges and a maximum flow rate of
- Page 81 and 82:
could be wound above or below the l
- Page 83 and 84:
4 EXPERIMENTAL SETUP AND METHODS He
- Page 85 and 86:
4.2 Flow visualisation and model pa
- Page 87 and 88:
any divergence from the beam and to
- Page 89 and 90:
even flow over 0.45m width and up t
- Page 91 and 92:
Chapter 2 Opt 1 h(m) 0.01 Max D(m)
- Page 93 and 94:
Chapter 2 Part of side section Putt
- Page 95 and 96:
Chapter 2 Suction tank Bypass Disch
- Page 97 and 98:
Chapter 2 QUncorrectedflow £ Corre
- Page 99 and 100:
Chapter 2 60 r 501 40? 30r 20 r lOr
- Page 101 and 102:
1_ INTRODUCTION The main features o
- Page 103 and 104:
2 EXPERIMENTAL METHODS A detailed d
- Page 105 and 106:
the relationship is then simply ^ -
- Page 107 and 108:
number about 0.14. They were taken
- Page 109 and 110:
along the stoss slope. Figures 8 an
- Page 111 and 112:
3.3a) Jetting trajectories when U/V
- Page 113 and 114:
errors increase substantially due t
- Page 115 and 116:
likely distributions. 4 DISCUSSION
- Page 117 and 118:
Our suggestion here is akin to that
- Page 119 and 120:
not accommodate the differing migra
- Page 121 and 122:
considered by proponents of numeric
- Page 123 and 124:
Chapter 3 C,;: Figure 3a-j. The pla
- Page 125 and 126:
Q CO 23 Figure 6. Distribution of p
- Page 127 and 128:
Chapter 3 X(cm) 1 2 3 4 5 6 7 8 9 1
- Page 129 and 130:
Chapter 3 U(m/s) V(m/s) U/V M1+M2 M
- Page 131 and 132:
O I r+ 21 CO 2 5 8 11 14 17 20 23 >
- Page 133 and 134:
8 11 14 17 20 23 25 + Position Figu
- Page 135 and 136:
Chapter 3 U/V= B5.7 Q9.3 BlO.7^12.8
- Page 137 and 138:
Chapter 3 Band 1 2 3 4 U(m/s) 0.2 0
- Page 139 and 140:
1 INTRODUCTION In chapter 3 we cons
- Page 141 and 142:
velocity for a maximum of 40% of th
- Page 143 and 144:
layer vortices extending over the d
- Page 145 and 146:
2.2 Methods for measuring Coanda-fl
- Page 147 and 148:
Section 3.4 considers suspension fr
- Page 149 and 150:
This same flow structure has also b
- Page 151 and 152:
3.2b) Effect of varying inter-crest
- Page 153 and 154:
those with fall speed 0.060m/s for
- Page 155 and 156:
3.4 Particle capture from stoss slo
- Page 157 and 158:
are discussed in the context of est
- Page 159 and 160:
jetted grains settling to the lee s
- Page 161 and 162:
Chapter 4 ENTRAINED FLOW Figure 1.
- Page 163 and 164:
Figure 3a-j. The plates show partic
- Page 165 and 166:
Chapter 4 Percentage occurrence •
- Page 167 and 168:
Chapter 4 Interval (s) 60 80 100 12
- Page 169 and 170:
Chapter 4 0.024m Conc=8% Figure 12.
- Page 171 and 172:
Chapter 4 Figure 16. A cloud of par
- Page 173 and 174:
1 INTRODUCTION We use a Rankine vor
- Page 175 and 176:
effective particle fall speed in th
- Page 177 and 178:
particle velocity Vx=0. The initial
- Page 179 and 180:
the vortex axis. Vortex circulation
- Page 181 and 182:
dimensional fall times T^ for diffe
- Page 183 and 184:
horizontal component lift force (fi
- Page 185 and 186:
corresponds to the trajectory trave
- Page 187 and 188:
stepping the calculation in VT . Do
- Page 189 and 190:
averaged exclusion of the coherent
- Page 191 and 192:
C from figure 11 (ie 2.2) then we h
- Page 193 and 194:
PflRTICLE DENSITY=1000.000 Kg/n3 LI
- Page 195 and 196:
Chapter 5 ft) J k I Figure 4. Varyi
- Page 197 and 198:
Chapter 5 Relative Fall Time va Sta
- Page 199 and 200:
Chapter 5 Figure 7a. Trajectories o
- Page 201 and 202:
Chapter 5 Velocity X —Inertia X L
- Page 203 and 204:
Chapter 5 Velocity X —Velocity Y
- Page 205 and 206:
Chapter 5 Velocity Y Inertia Y Lift
- Page 207 and 208:
Chapter 5 DENSITY PARTICLE=2850.000
- Page 209 and 210:
Chapter 5 Rad = 0.006 Rad=0.003 Rad
- Page 211 and 212:
Chapter 5 H3 Y=0 Oy=i m Y=2 D-y=3
- Page 213 and 214:
CHAPTER 6: NUMERICAL SIMULATION OF
- Page 215 and 216:
next. If we now adopt the classical
- Page 217 and 218:
st = (4) Where p p was the particle
- Page 219 and 220:
3 RESULTS 3.1 Specified 6 and V Fig
- Page 221 and 222:
the blue squares to double loops an
- Page 223 and 224:
A0fl0 = 1.25V-0.33G-0.005 (7) and f
- Page 225 and 226:
Conversely, the upper line of the p
- Page 227 and 228:
equations. Such a discrete vortex m
- Page 229 and 230:
Figure 1. Schematic of the shear la
- Page 231 and 232:
Chapter 6 J G H K M Figure 3. Seven
- Page 233 and 234:
Chapter 6 1 T V=0.161 0.1 -- V41185
- Page 235 and 236:
Chapter 6 - DataV=0.0335, G=0.01
- Page 237 and 238:
CHAPTER 7: RECAPITULATION AND RECOM
- Page 239 and 240:
were shown to compare well with pre
- Page 241 and 242:
We have shown Coanda-flapping makes
- Page 243 and 244:
figure 5, was critically dependant
- Page 245 and 246:
stoss slope suspension studies of c
- Page 247 and 248:
Figure la-g. The seven trajectory m
- Page 249 and 250:
Chapter 7
- Page 251 and 252:
Chapter 7 0.0351 0.03 " 03 0.025 0.
- Page 253 and 254:
Flow 16 (1) pp 19-34. Bernal LP (19
- Page 255 and 256:
Mechanics of Sediment Transport. Is
- Page 257 and 258:
turbulence near a smooth wall in a
- Page 259 and 260:
moderate Reynolds number shear laye
- Page 261 and 262:
Spalding (1961). A single formula f
- Page 263 and 264:
USA. 1-12
- Page 265 and 266:
APPENDIX 1: BOUNDARY LAYER STUDIES
- Page 267 and 268:
(1967) used hydrogen bubble visuali
- Page 269 and 270:
The burst-sweep dynamics study of U
- Page 271 and 272:
Horseshoe vortex Vortex filament Ho
- Page 273 and 274:
APPENDIX 2: FAST9003.HR(RW)/NHT - P
- Page 275 and 276:
of the vorticity shed into the near
- Page 277 and 278:
transport dynamics of multiphase fl
- Page 279 and 280:
APPENDIX 3: FUNDAMENTAL NAVIER-STOK
- Page 281 and 282:
APPENDIX 4: CLOSURE METHODS 1 ZERO
- Page 283 and 284:
where cr k and CD are empirical con
- Page 285 and 286:
K = CDe^ 2 p 2 \U2 -U1 \=e 1e 2 c (
- Page 287 and 288:
APPENDIX 6: K-e MODEL OF JOHNS ET A
- Page 289 and 290:
They then defined a hydrodynamic co
- Page 291 and 292:
with respect to the rest of the vor
- Page 293 and 294:
The vorticity equation can be split
- Page 295 and 296:
around the crest and the motion of
- Page 297 and 298:
micrometers, with mean of 80 microm
- Page 299 and 300:
i——COMPARISON WITH PREVIOUS WOR
- Page 301 and 302:
width speed (metres) ^(cm/s) 11 Fig
- Page 303 and 304:
U (33) = 1.16ms-' Depth = 2.65 m Fi
- Page 305 and 306:
APPENDIX 9 : DERIVATION OF FORCES O
- Page 307 and 308:
APPENDIX 10 : MODEL CODE FOR CALCUL
- Page 309 and 310:
APPENDIX 11: MODEL CODE FOR GROWING
- Page 311:
105 if (scancode .eq. 57) stop GOTO