Gender Diversity on the Board - BI Norwegian Business School
Gender Diversity on the Board - BI Norwegian Business School
Gender Diversity on the Board - BI Norwegian Business School

You also want an ePaper? Increase the reach of your titles
YUMPU automatically turns print PDFs into web optimized ePapers that Google loves.
GRA 19001 Master Thesis<br />
4 Descriptive statistics<br />
In this secti<strong>on</strong> descriptive statistics for firm size, female stockholder-elected directors,<br />
return <strong>on</strong> assets (ROA), fracti<strong>on</strong> held by largest ultimate family owner (family owner)<br />
and CEO-gender are presented. We start by examining <strong>the</strong> size distributi<strong>on</strong> of all firms,<br />
n<strong>on</strong>listed firms and listed firms. A firm is classified as small if it has assets below €10<br />
milli<strong>on</strong>. If assets are between €10 and €43 milli<strong>on</strong> it is classified as medium-sized firms.<br />
Everything above is c<strong>on</strong>sidered large firms. This classificati<strong>on</strong> is made according to EUstandards<br />
(European Commissi<strong>on</strong>, 2009). Table 4.1 presents descriptive statistics for<br />
firm size for <strong>the</strong> year 2005.<br />
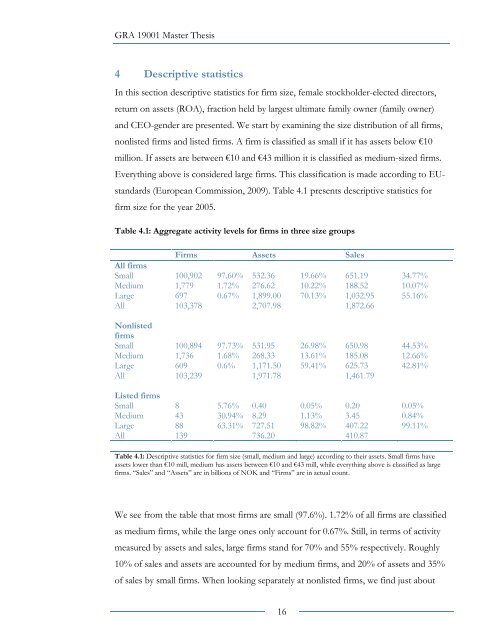
Table 4.1: Aggregate activity levels for firms in three size groups<br />
Firms Assets Sales<br />
All firms<br />
Small 100,902 97.60% 532.36 19.66% 651.19 34.77%<br />
Medium 1,779 1.72% 276.62 10.22% 188.52 10.07%<br />
Large 697 0.67% 1,899.00 70.13% 1,032.95 55.16%<br />
All 103,378 2,707.98 1,872.66<br />
N<strong>on</strong>listed<br />
firms<br />
Small 100,894 97.73% 531.95 26.98% 650.98 44.53%<br />
Medium 1,736 1.68% 268.33 13.61% 185.08 12.66%<br />
Large 609 0.6% 1,171.50 59.41% 625.73 42.81%<br />
All 103,239 1,971.78 1,461.79<br />
Listed firms<br />
Small 8 5.76% 0.40 0.05% 0.20 0.05%<br />
Medium 43 30.94% 8.29 1.13% 3.45 0.84%<br />
Large 88 63.31% 727.51 98.82% 407.22 99.11%<br />
All 139 736.20 410.87<br />
Table 4.1: Descriptive statistics for firm size (small, medium and large) according to <strong>the</strong>ir assets. Small firms have<br />
assets lower than €10 mill, medium has assets between €10 and €43 mill, while everything above is classified as large<br />
firms. “Sales” and “Assets” are in billi<strong>on</strong>s of NOK and “Firms” are in actual count.<br />
We see from <strong>the</strong> table that most firms are small (97.6%). 1.72% of all firms are classified<br />
as medium firms, while <strong>the</strong> large <strong>on</strong>es <strong>on</strong>ly account for 0.67%. Still, in terms of activity<br />
measured by assets and sales, large firms stand for 70% and 55% respectively. Roughly<br />
10% of sales and assets are accounted for by medium firms, and 20% of assets and 35%<br />
of sales by small firms. When looking separately at n<strong>on</strong>listed firms, we find just about<br />
16