Gender Diversity on the Board - BI Norwegian Business School
Gender Diversity on the Board - BI Norwegian Business School
Gender Diversity on the Board - BI Norwegian Business School

Create successful ePaper yourself
Turn your PDF publications into a flip-book with our unique Google optimized e-Paper software.
GRA 19001 Master Thesis<br />
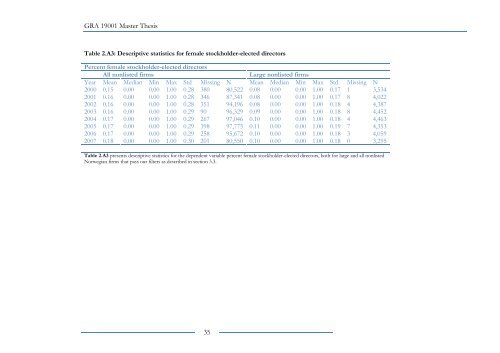
Table 2.A3: Descriptive statistics for female stockholder-elected directors<br />
Percent female stockholder-elected directors<br />
All n<strong>on</strong>listed firms<br />
Large n<strong>on</strong>listed firms<br />
Year Mean Median Min Max Std Missing N Mean Median Min Max Std Missing N<br />
2000 0.15 0.00 0.00 1.00 0.28 380 80,522 0.08 0.00 0.00 1.00 0.17 1 3,534<br />
2001 0.16 0.00 0.00 1.00 0.28 346 87,341 0.08 0.00 0.00 1.00 0.17 8 4,022<br />
2002 0.16 0.00 0.00 1.00 0.28 351 94,196 0.08 0.00 0.00 1.00 0.18 4 4,387<br />
2003 0.16 0.00 0.00 1.00 0.29 90 96,329 0.09 0.00 0.00 1.00 0.18 8 4,452<br />
2004 0.17 0.00 0.00 1.00 0.29 267 97,046 0.10 0.00 0.00 1.00 0.18 4 4,463<br />
2005 0.17 0.00 0.00 1.00 0.29 398 97,775 0.11 0.00 0.00 1.00 0.19 7 4,353<br />
2006 0.17 0.00 0.00 1.00 0.29 258 95,672 0.10 0.00 0.00 1.00 0.18 3 4,059<br />
2007 0.18 0.00 0.00 1.00 0.30 201 80,550 0.10 0.00 0.00 1.00 0.18 0 3,295<br />
Table 2.A3 presents descriptive statistics for <strong>the</strong> dependent variable percent female stockholder-elected directors, both for large and all n<strong>on</strong>listed<br />
<strong>Norwegian</strong> firms that pass our filters as described in secti<strong>on</strong> 3.3.<br />
35