Gender Diversity on the Board - BI Norwegian Business School
Gender Diversity on the Board - BI Norwegian Business School
Gender Diversity on the Board - BI Norwegian Business School

You also want an ePaper? Increase the reach of your titles
YUMPU automatically turns print PDFs into web optimized ePapers that Google loves.
GRA 19001 Master Thesis<br />
6 Robustness<br />
In this secti<strong>on</strong> we analyze <strong>the</strong> effect of ignoring fixed effects accounted for in secti<strong>on</strong><br />
5.1, and regress <strong>the</strong> model by using <strong>the</strong> mean calculated in <strong>the</strong> fixed effects model. We<br />
apply pooled OLS and <strong>the</strong> between-model to test <strong>the</strong> robustness of <strong>the</strong> basic model. The<br />
variables used are <strong>the</strong> same as in <strong>the</strong> basic model, but are no l<strong>on</strong>ger demeaned. In pooled<br />
OLS each observati<strong>on</strong> <strong>on</strong> a firm is treated as a separate observati<strong>on</strong> without reflecting<br />
that it comes from <strong>the</strong> same firm. Thus <strong>the</strong> grouped nature of <strong>the</strong> data is ignored, and<br />
<strong>the</strong> model does not tell us whe<strong>the</strong>r <strong>the</strong> resp<strong>on</strong>se of explanatory variables over time is <strong>the</strong><br />
same for all firms. In o<strong>the</strong>r words, we ignore <strong>the</strong> heterogeneity that may exist. As a<br />
c<strong>on</strong>sequence, <strong>the</strong> error term may be correlated with <strong>the</strong> explanatory variables. In this<br />
case, <strong>the</strong> estimated coefficients may be biased as well as inc<strong>on</strong>sistent. (Petersen, 2004). In<br />
<strong>the</strong> between-model <strong>on</strong>e computes an average value for each firm, <strong>on</strong> each variable, and<br />
uses this value as an observati<strong>on</strong>. We <strong>the</strong>n run regressi<strong>on</strong>s using ordinary least squares.<br />
This estimator makes comparis<strong>on</strong>s between firms in <strong>the</strong>ir average outcomes. Compared<br />
to <strong>the</strong> base-case model, <strong>the</strong> data is used less efficiently, with <strong>on</strong>ly <strong>on</strong>e observati<strong>on</strong> per<br />
firm. (Petersen, 2004)<br />
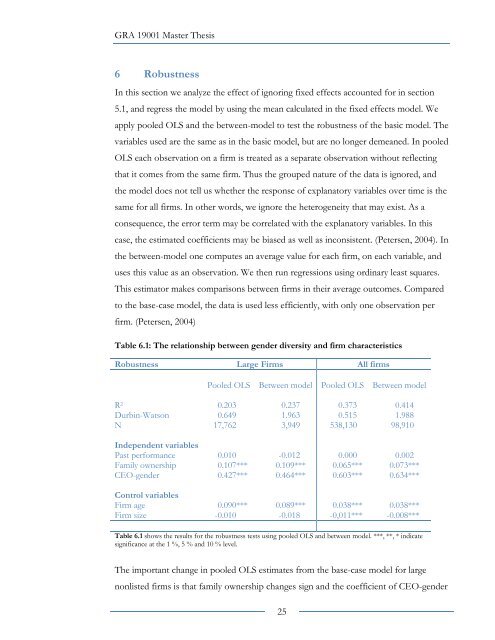
Table 6.1: The relati<strong>on</strong>ship between gender diversity and firm characteristics<br />
Robustness Large Firms All firms<br />
Pooled OLS Between model Pooled OLS Between model<br />
R 2 0.203 0.237 0.373 0.414<br />
Durbin-Wats<strong>on</strong> 0.649 1.963 0.515 1.988<br />
N 17,762 3,949 538,130 98,910<br />
Independent variables<br />
Past performance 0.010 -0.012 0.000 0.002<br />
Family ownership 0.107*** 0.109*** 0.065*** 0.073***<br />
CEO-gender 0.427*** 0.464*** 0.603*** 0.634***<br />
C<strong>on</strong>trol variables<br />
Firm age 0.090*** 0.089*** 0.038*** 0.038***<br />
Firm size -0.010 -0.018 -0,011*** -0.008***<br />
Table 6.1 shows <strong>the</strong> results for <strong>the</strong> robustness tests using pooled OLS and between model. ***, **, * indicate<br />
significance at <strong>the</strong> 1 %, 5 % and 10 % level.<br />
The important change in pooled OLS estimates from <strong>the</strong> base-case model for large<br />
n<strong>on</strong>listed firms is that family ownership changes sign and <strong>the</strong> coefficient of CEO-gender<br />
25