Gender Diversity on the Board - BI Norwegian Business School
Gender Diversity on the Board - BI Norwegian Business School
Gender Diversity on the Board - BI Norwegian Business School

Create successful ePaper yourself
Turn your PDF publications into a flip-book with our unique Google optimized e-Paper software.
Percent<br />
GRA 19001 Master Thesis<br />
share of observati<strong>on</strong>s in our sample. Therefore, we choose not to draw any c<strong>on</strong>clusi<strong>on</strong>s<br />
based <strong>on</strong> <strong>the</strong>se findings.<br />
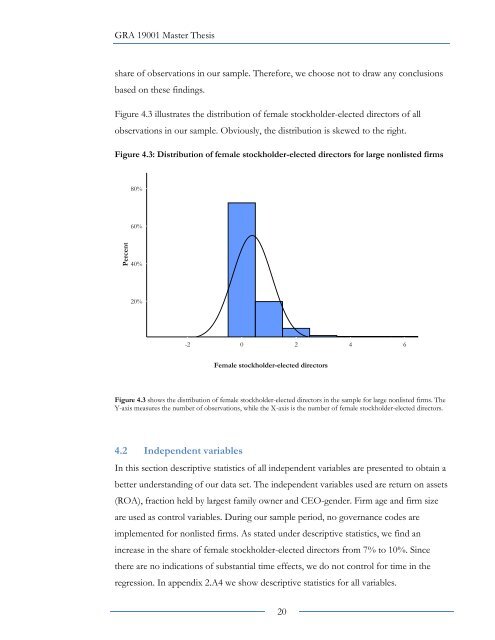
Figure 4.3 illustrates <strong>the</strong> distributi<strong>on</strong> of female stockholder-elected directors of all<br />
observati<strong>on</strong>s in our sample. Obviously, <strong>the</strong> distributi<strong>on</strong> is skewed to <strong>the</strong> right.<br />
Figure 4.3: Distributi<strong>on</strong> of female stockholder-elected directors for large n<strong>on</strong>listed firms<br />
80%<br />
60%<br />
40%<br />
20%<br />
-2<br />
0<br />
2<br />
4<br />
6<br />
Female stockholder-elected directors<br />
Figure 4.3 shows <strong>the</strong> distributi<strong>on</strong> of female stockholder-elected directors in <strong>the</strong> sample for large n<strong>on</strong>listed firms. The<br />
Y-axis measures <strong>the</strong> number of observati<strong>on</strong>s, while <strong>the</strong> X-axis is <strong>the</strong> number of female stockholder-elected directors.<br />
4.2 Independent variables<br />
In this secti<strong>on</strong> descriptive statistics of all independent variables are presented to obtain a<br />
better understanding of our data set. The independent variables used are return <strong>on</strong> assets<br />
(ROA), fracti<strong>on</strong> held by largest family owner and CEO-gender. Firm age and firm size<br />
are used as c<strong>on</strong>trol variables. During our sample period, no governance codes are<br />
implemented for n<strong>on</strong>listed firms. As stated under descriptive statistics, we find an<br />
increase in <strong>the</strong> share of female stockholder-elected directors from 7% to 10%. Since<br />
<strong>the</strong>re are no indicati<strong>on</strong>s of substantial time effects, we do not c<strong>on</strong>trol for time in <strong>the</strong><br />
regressi<strong>on</strong>. In appendix 2.A4 we show descriptive statistics for all variables.<br />
20