Gender Diversity on the Board - BI Norwegian Business School
Gender Diversity on the Board - BI Norwegian Business School
Gender Diversity on the Board - BI Norwegian Business School

Create successful ePaper yourself
Turn your PDF publications into a flip-book with our unique Google optimized e-Paper software.
GRA 19001 Master Thesis<br />
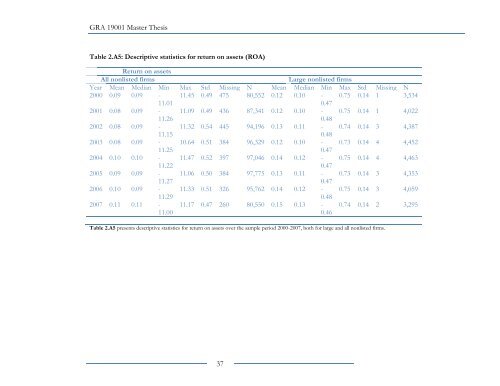
Table 2.A5: Descriptive statistics for return <strong>on</strong> assets (ROA)<br />
Return <strong>on</strong> assets<br />
All n<strong>on</strong>listed firms<br />
Large n<strong>on</strong>listed firms<br />
Year Mean Median Min Max Std Missing N Mean Median Min Max Std Missing N<br />
2000 0.09 0.09 - 11.45 0.49 475 80,552 0.12 0.10 - 0.75 0.14 1 3,534<br />
11.01<br />
0.47<br />
2001 0.08 0.09 - 11.09 0.49 436 87,341 0.12 0.10 - 0.75 0.14 1 4,022<br />
11.26<br />
0.48<br />
2002 0.08 0.09 - 11.32 0.54 445 94,196 0.13 0.11 - 0.74 0.14 3 4,387<br />
11.15<br />
0.48<br />
2003 0.08 0.09 - 10.64 0.51 384 96,329 0.12 0.10 - 0.73 0.14 4 4,452<br />
11.25<br />
0.47<br />
2004 0.10 0.10 - 11.47 0.52 397 97,046 0.14 0.12 - 0.75 0.14 4 4,463<br />
11.22<br />
0.47<br />
2005 0.09 0.09 - 11.06 0.50 384 97,775 0.13 0.11 - 0.73 0.14 3 4,353<br />
11.27<br />
0.47<br />
2006 0.10 0.09 - 11.33 0.51 326 95,762 0.14 0.12 - 0.75 0.14 3 4,059<br />
11.29<br />
0.48<br />
2007 0.11 0.11 -<br />
11.00<br />
11.17 0.47 260 80,550 0.15 0.13 -<br />
0.46<br />
0.74 0.14 2 3,295<br />
Table 2.A5 presents descriptive statistics for return <strong>on</strong> assets over <strong>the</strong> sample period 2000-2007, both for large and all n<strong>on</strong>listed firms.<br />
37