Gender Diversity on the Board - BI Norwegian Business School
Gender Diversity on the Board - BI Norwegian Business School
Gender Diversity on the Board - BI Norwegian Business School

Create successful ePaper yourself
Turn your PDF publications into a flip-book with our unique Google optimized e-Paper software.
GRA 19001 Master Thesis<br />
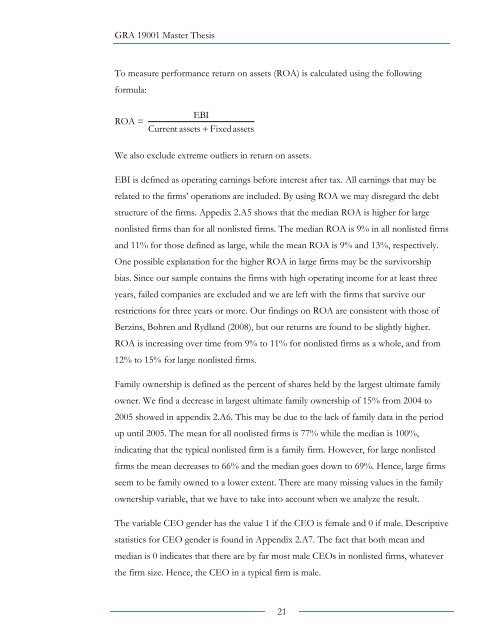
To measure performance return <strong>on</strong> assets (ROA) is calculated using <strong>the</strong> following<br />
formula:<br />
E<strong>BI</strong><br />
ROA =<br />
Current assets Fixedassets<br />
We also exclude extreme outliers in return <strong>on</strong> assets.<br />
E<strong>BI</strong> is defined as operating earnings before interest after tax. All earnings that may be<br />
related to <strong>the</strong> firms’ operati<strong>on</strong>s are included. By using ROA we may disregard <strong>the</strong> debt<br />
structure of <strong>the</strong> firms. Appedix 2.A5 shows that <strong>the</strong> median ROA is higher for large<br />
n<strong>on</strong>listed firms than for all n<strong>on</strong>listed firms. The median ROA is 9% in all n<strong>on</strong>listed firms<br />
and 11% for those defined as large, while <strong>the</strong> mean ROA is 9% and 13%, respectively.<br />
One possible explanati<strong>on</strong> for <strong>the</strong> higher ROA in large firms may be <strong>the</strong> survivorship<br />
bias. Since our sample c<strong>on</strong>tains <strong>the</strong> firms with high operating income for at least three<br />
years, failed companies are excluded and we are left with <strong>the</strong> firms that survive our<br />
restricti<strong>on</strong>s for three years or more. Our findings <strong>on</strong> ROA are c<strong>on</strong>sistent with those of<br />
Berzins, Bøhren and Rydland (2008), but our returns are found to be slightly higher.<br />
ROA is increasing over time from 9% to 11% for n<strong>on</strong>listed firms as a whole, and from<br />
12% to 15% for large n<strong>on</strong>listed firms.<br />
Family ownership is defined as <strong>the</strong> percent of shares held by <strong>the</strong> largest ultimate family<br />
owner. We find a decrease in largest ultimate family ownership of 15% from 2004 to<br />
2005 showed in appendix 2.A6. This may be due to <strong>the</strong> lack of family data in <strong>the</strong> period<br />
up until 2005. The mean for all n<strong>on</strong>listed firms is 77% while <strong>the</strong> median is 100%,<br />
indicating that <strong>the</strong> typical n<strong>on</strong>listed firm is a family firm. However, for large n<strong>on</strong>listed<br />
firms <strong>the</strong> mean decreases to 66% and <strong>the</strong> median goes down to 69%. Hence, large firms<br />
seem to be family owned to a lower extent. There are many missing values in <strong>the</strong> family<br />
ownership variable, that we have to take into account when we analyze <strong>the</strong> result.<br />
The variable CEO gender has <strong>the</strong> value 1 if <strong>the</strong> CEO is female and 0 if male. Descriptive<br />
statistics for CEO gender is found in Appendix 2.A7. The fact that both mean and<br />
median is 0 indicates that <strong>the</strong>re are by far most male CEOs in n<strong>on</strong>listed firms, whatever<br />
<strong>the</strong> firm size. Hence, <strong>the</strong> CEO in a typical firm is male.<br />
21