Gender Diversity on the Board - BI Norwegian Business School
Gender Diversity on the Board - BI Norwegian Business School
Gender Diversity on the Board - BI Norwegian Business School

You also want an ePaper? Increase the reach of your titles
YUMPU automatically turns print PDFs into web optimized ePapers that Google loves.
GRA 19001 Master Thesis<br />
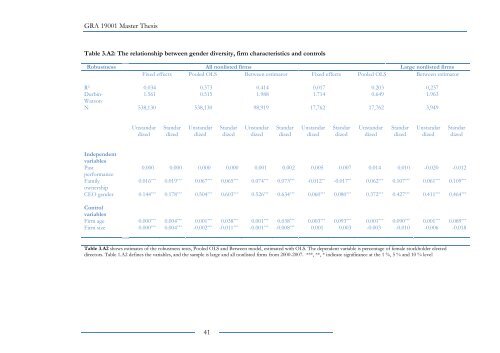
Table 3.A2: The relati<strong>on</strong>ship between gender diversity, firm characteristics and c<strong>on</strong>trols<br />
Robustness All n<strong>on</strong>listed firms Large n<strong>on</strong>listed firms<br />
Fixed effects Pooled OLS Between estimator Fixed effects Pooled OLS Between estimator<br />
R 2 0.034 0.373 0.414 0.017 0.203 0,237<br />
Durbin-<br />
1.561 0.515 1.988 1.714 0.649 1.963<br />
Wats<strong>on</strong><br />
N 538,130 538,130 98,919 17,762 17,762 3,949<br />
Unstandar<br />
dized<br />
Standar<br />
dized<br />
Unstandar<br />
dized<br />
Standar<br />
dized<br />
Unstandar<br />
dized<br />
Standar<br />
dized<br />
Unstandar<br />
dized<br />
Standar<br />
dized<br />
Unstandar<br />
dized<br />
Standar<br />
dized<br />
Unstandar<br />
dized<br />
Standar<br />
dized<br />
Independent<br />
variables<br />
Past<br />
0.000 0.000 0.000 0.000 0.001 0.002 0.005 0.007 0.014 0.010 -0.020 -0.012<br />
performance<br />
Family<br />
0.016 *** 0.019 *** 0.067 *** 0.065 *** 0.074 *** 0.073 *** -0.012 ** -0.017 ** 0.062 *** 0.107 *** 0.061 *** 0.109 ***<br />
ownership<br />
CEO gender 0.144 *** 0.178 *** 0.504 *** 0.603 *** 0.526 *** 0.634 *** 0.060 *** 0.080 *** 0.372 *** 0.427 *** 0.411 *** 0.464 ***<br />
C<strong>on</strong>trol<br />
variables<br />
Firm age 0.000 *** 0.004 *** 0.001 *** 0.038 *** 0.001 *** 0.038 *** 0.003 *** 0.093 *** 0.001 *** 0.090 *** 0.001 *** 0.089 ***<br />
Firm size 0.000 *** 0.004 *** -0.002 *** -0.011 *** -0.001 *** -0.008 *** 0.001 0.003 -0.003 -0.010 -0.006 -0.018<br />
Table 3.A2 shows estimates of <strong>the</strong> robustness tests, Pooled OLS and Between model, estimated with OLS. The dependent variable is percentage of female stockholder elected<br />
directors. Table 1.A2 defines <strong>the</strong> variables, and <strong>the</strong> sample is large and all n<strong>on</strong>listed firms from 2000-2007. ***, **, * indicate significance at <strong>the</strong> 1 %, 5 % and 10 % level<br />
41