Health Services Commissioner Annual Report 2000/2001
Health Services Commissioner Annual Report 2000/2001
Health Services Commissioner Annual Report 2000/2001

Create successful ePaper yourself
Turn your PDF publications into a flip-book with our unique Google optimized e-Paper software.
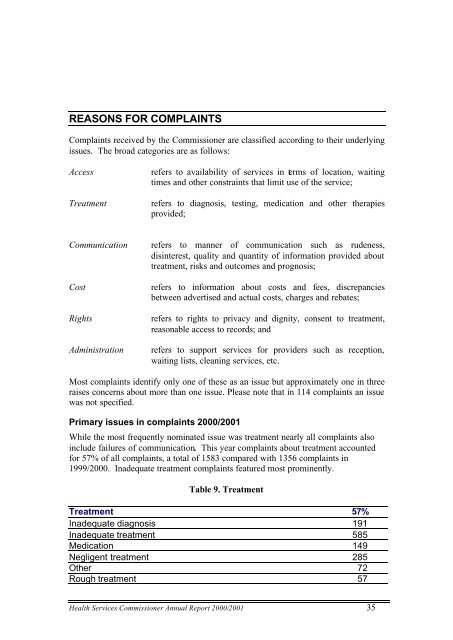
REASONS FOR COMPLAINTS<br />
Complaints received by the <strong>Commissioner</strong> are classified according to their underlying<br />
issues. The broad categories are as follows:<br />
Access<br />
Treatment<br />
refers to availability of services in terms of location, waiting<br />
times and other constraints that limit use of the service;<br />
refers to diagnosis, testing, medication and other therapies<br />
provided;<br />
Communication<br />
Cost<br />
Rights<br />
Administration<br />
refers to manner of communication such as rudeness,<br />
disinterest, quality and quantity of information provided about<br />
treatment, risks and outcomes and prognosis;<br />
refers to information about costs and fees, discrepancies<br />
between advertised and actual costs, charges and rebates;<br />
refers to rights to privacy and dignity, consent to treatment,<br />
reasonable access to records; and<br />
refers to support services for providers such as reception,<br />
waiting lists, cleaning services, etc.<br />
Most complaints identify only one of these as an issue but approximately one in three<br />
raises concerns about more than one issue. Please note that in 114 complaints an issue<br />
was not specified.<br />
Primary issues in complaints <strong>2000</strong>/<strong>2001</strong><br />
While the most frequently nominated issue was treatment nearly all complaints also<br />
include failures of communication. This year complaints about treatment accounted<br />
for 57% of all complaints, a total of 1583 compared with 1356 complaints in<br />
1999/<strong>2000</strong>. Inadequate treatment complaints featured most prominently.<br />
Table 9. Treatment<br />
Treatment 57%<br />
Inadequate diagnosis 191<br />
Inadequate treatment 585<br />
Medication 149<br />
Negligent treatment 285<br />
Other 72<br />
Rough treatment 57<br />
<strong>Health</strong> <strong>Services</strong> <strong>Commissioner</strong> <strong>Annual</strong> <strong>Report</strong> <strong>2000</strong>/<strong>2001</strong> 35