- Page 2 and 3:
NORTHERN PROVINCE GAUTENG MPUMALANG
- Page 4:
Foreword Among significant events t
- Page 7 and 8:
14 Voices of National and Provincia
- Page 10 and 11:
Preface Listening to ‘Voices’
- Page 12 and 13:
an urgent need to improve the curre
- Page 14 and 15:
Transformation “Things happen so
- Page 16 and 17:
Introduction Health legislation is
- Page 18 and 19:
grounds. This was driven by the nee
- Page 20 and 21:
statutory powers in terms of the FA
- Page 22 and 23:
ecommend that the Minister make reg
- Page 24 and 25:
the expansion of their programme to
- Page 26 and 27:
Health Services are provided for in
- Page 28 and 29:
of a circumcision operation and the
- Page 30 and 31:
References 1 Report by the Joint Mo
- Page 32 and 33:
Introduction The District Health Sy
- Page 34 and 35:
(viz. environmental health services
- Page 36 and 37:
district’. This arrangement of su
- Page 38 and 39:
To illustrate the progress made tow
- Page 40 and 41:
References 1 Department of Health.
- Page 42:
Eastern Cape Category A and C Munic
- Page 46:
Gauteng Category A and C Municipali
- Page 50:
Mpumalanga Category A and C Municip
- Page 54:
Northern Province Category A and C
- Page 58:
Western Cape Category A and C Munic
- Page 61 and 62:
2 • The District Health System Ap
- Page 63 and 64:
Financing Local Government Health S
- Page 65 and 66:
3 • Financing Local Government He
- Page 67 and 68:
3 • Financing Local Government He
- Page 69 and 70:
3 • Financing Local Government He
- Page 71 and 72:
3 • Financing Local Government He
- Page 73 and 74:
3 • Financing Local Government He
- Page 75 and 76:
3 • Financing Local Government He
- Page 77 and 78:
3 • Financing Local Government He
- Page 79 and 80:
3 • Financing Local Government He
- Page 81 and 82:
3 • Financing Local Government He
- Page 83 and 84:
Private Sector Financing 4 Jane Gou
- Page 85 and 86:
4 • Private Sector Financing Fina
- Page 87 and 88:
4 • Private Sector Financing Tabl
- Page 89 and 90:
4 • Private Sector Financing Tabl
- Page 91 and 92:
4 • Private Sector Financing Tabl
- Page 93 and 94:
4 • Private Sector Financing cons
- Page 95 and 96:
4 • Private Sector Financing priv
- Page 97 and 98:
Public-Private Partnerships 5 Julia
- Page 99 and 100:
5 • Public-Private Partnerships t
- Page 101 and 102:
5 • Public-Private Partnerships B
- Page 103 and 104:
5 • Public-Private Partnerships P
- Page 105 and 106:
5 • Public-Private Partnerships a
- Page 107 and 108:
5 • Public-Private Partnerships S
- Page 109 and 110:
5 • Public-Private Partnerships E
- Page 111 and 112:
5 • Public-Private Partnerships e
- Page 113 and 114:
5 • Public-Private Partnerships s
- Page 115 and 116:
Using Information for Health 6 Loui
- Page 117 and 118:
6 • Using Information for Health
- Page 119 and 120:
6 • Using Information for Health
- Page 121 and 122:
6 • Using Information for Health
- Page 123 and 124:
6 • Using Information for Health
- Page 125 and 126:
6 • Using Information for Health
- Page 127 and 128:
6 • Using Information for Health
- Page 129 and 130:
6 • Using Information for Health
- Page 131 and 132:
Annual Reports and the Public Finan
- Page 133 and 134:
7 • Annual Reports and the Public
- Page 135 and 136:
7 • Annual Reports and the Public
- Page 137 and 138:
7 • Annual Reports and the Public
- Page 139 and 140:
7 • Annual Reports and the Public
- Page 141 and 142:
7 • Annual Reports and the Public
- Page 143 and 144:
7 • Annual Reports and the Public
- Page 145 and 146:
7 • Annual Reports and the Public
- Page 147 and 148:
7 • Annual Reports and the Public
- Page 149 and 150:
7 • Annual Reports and the Public
- Page 151 and 152:
HIV/AIDS Financing 8 Paul Whelan In
- Page 153 and 154:
8 • HIV/AIDS Financing discussed
- Page 155 and 156:
8 • HIV/AIDS Financing Provincial
- Page 157 and 158:
8 • HIV/AIDS Financing Funds to p
- Page 159 and 160:
8 • HIV/AIDS Financing have short
- Page 161 and 162:
8 • HIV/AIDS Financing plans requ
- Page 163 and 164:
8 • HIV/AIDS Financing district H
- Page 165 and 166:
8 • HIV/AIDS Financing The fundin
- Page 167 and 168:
8 • HIV/AIDS Financing Gauteng: G
- Page 169 and 170:
8 • HIV/AIDS Financing condoms, a
- Page 171 and 172:
8 • HIV/AIDS Financing Conditiona
- Page 173 and 174:
8 • HIV/AIDS Financing Financial
- Page 175 and 176:
Mainstreaming HIV/AIDS Progress and
- Page 177 and 178:
9 • Mainstreaming HIV/AIDS magnit
- Page 179 and 180:
9 • Mainstreaming HIV/AIDS Figure
- Page 181 and 182:
9 • Mainstreaming HIV/AIDS from t
- Page 183 and 184:
9 • Mainstreaming HIV/AIDS The sy
- Page 185 and 186:
9 • Mainstreaming HIV/AIDS Preven
- Page 187 and 188:
9 • Mainstreaming HIV/AIDS Anothe
- Page 189 and 190:
9 • Mainstreaming HIV/AIDS Notwit
- Page 191 and 192:
9 • Mainstreaming HIV/AIDS the im
- Page 193 and 194:
9 • Mainstreaming HIV/AIDS Rememb
- Page 195 and 196:
9 • Mainstreaming HIV/AIDS 8 Kiro
- Page 197 and 198:
9 • Mainstreaming HIV/AIDS 47 Ken
- Page 199 and 200:
Voices of Service Users 10 Precious
- Page 201 and 202:
10 • Voices of Services Users acc
- Page 203 and 204:
10 • Voices of Services Users Fac
- Page 205 and 206:
10 • Voices of Services Users ena
- Page 207 and 208:
10 • Voices of Services Users Box
- Page 209 and 210:
10 • Voices of Services Users Mor
- Page 211 and 212:
10 • Voices of Services Users wit
- Page 213 and 214:
10 • Voices of Services Users Con
- Page 215 and 216:
Voices of Health Policy Makers and
- Page 217 and 218:
• Voices of Health Policy Makers
- Page 219 and 220:
Voices of Facility Managers 11 Nata
- Page 221 and 222:
11 • Voices of Facility Managers
- Page 223 and 224:
11 • Voices of Facility Managers
- Page 225 and 226:
11 • Voices of Facility Managers
- Page 227 and 228:
11 • Voices of Facility Managers
- Page 229 and 230:
11 • Voices of Facility Managers
- Page 231 and 232:
11 • Voices of Facility Managers
- Page 233 and 234:
Voices of Hospital Superintendents/
- Page 235 and 236:
12 • Voices of Hospital Superinte
- Page 237 and 238:
12 • Voices of Hospital Superinte
- Page 239 and 240:
12 • Voices of Hospital Superinte
- Page 241 and 242:
12 • Voices of Hospital Superinte
- Page 243 and 244:
Voices of District Managers 13 Thul
- Page 245 and 246:
13 • Voices of District Managers
- Page 247 and 248:
13 • Voices of District Managers
- Page 249 and 250: 13 • Voices of District Managers
- Page 251 and 252: 13 • Voices of District Managers
- Page 253 and 254: 13 • Voices of District Managers
- Page 255 and 256: 13 • Voices of District Managers
- Page 257 and 258: Voices of National and Provincial M
- Page 259 and 260: 14 • Voices of National and Provi
- Page 261 and 262: 14 • Voices of National and Provi
- Page 263 and 264: 14 • Voices of National and Provi
- Page 265 and 266: 14 • Voices of National and Provi
- Page 267 and 268: 14 • Voices of National and Provi
- Page 269 and 270: 14 • Voices of National and Provi
- Page 271 and 272: 14 • Voices of National and Provi
- Page 273 and 274: Voices of Parliamentarians 15 Alfre
- Page 275 and 276: 15 • Voices of Parliamentarians D
- Page 277 and 278: 15 • Voices of Parliamentarians
- Page 279 and 280: 15 • Voices of Parliamentarians d
- Page 281 and 282: 15 • Voices of Parliamentarians T
- Page 283 and 284: 15 • Voices of Parliamentarians T
- Page 285 and 286: Voices of Health Policy Makers and
- Page 287 and 288: 16 • Voices of Health Policy Make
- Page 289 and 290: 16 • Voices of Health Policy Make
- Page 291 and 292: 16 • Voices of Health Policy Make
- Page 293 and 294: 16 • Voices of Health Policy Make
- Page 295 and 296: Health and Related Indicators 17 Ca
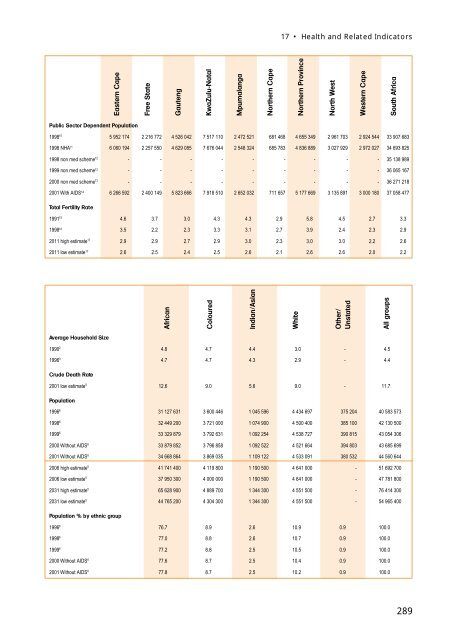
- Page 297 and 298: 17 • Health and Related Indicator
- Page 299: 17 • Health and Related Indicator
- Page 303 and 304: 17 • Health and Related Indicator
- Page 305 and 306: 17 • Health and Related Indicator
- Page 307 and 308: 17 • Health and Related Indicator
- Page 309 and 310: 17 • Health and Related Indicator
- Page 311 and 312: 17 • Health and Related Indicator
- Page 313 and 314: 17 • Health and Related Indicator
- Page 315 and 316: 17 • Health and Related Indicator
- Page 317 and 318: 17 • Health and Related Indicator
- Page 319 and 320: 17 • Health and Related Indicator
- Page 321 and 322: 17 • Health and Related Indicator
- Page 323 and 324: 17 • Health and Related Indicator
- Page 325 and 326: 17 • Health and Related Indicator
- Page 327 and 328: 17 • Health and Related Indicator
- Page 329 and 330: 17 • Health and Related Indicator
- Page 331 and 332: 17 • Health and Related Indicator
- Page 333 and 334: 17 • Health and Related Indicator
- Page 335 and 336: 17 • Health and Related Indicator
- Page 337 and 338: 17 • Health and Related Indicator
- Page 339 and 340: 17 • Health and Related Indicator
- Page 341 and 342: 17 • Health and Related Indicator
- Page 343 and 344: 17 • Health and Related Indicator
- Page 345 and 346: 17 • Health and Related Indicator
- Page 347 and 348: 17 • Health and Related Indicator
- Page 349 and 350: 17 • Health and Related Indicator
- Page 351 and 352:
17 • Health and Related Indicator
- Page 353 and 354:
Glossary AIDS Acquired Immune Defic
- Page 355 and 356:
• Glossary MEC MINMEC MOU Member
- Page 357 and 358:
Index A Abortion (see Termination o
- Page 359 and 360:
• Index Condoms .................