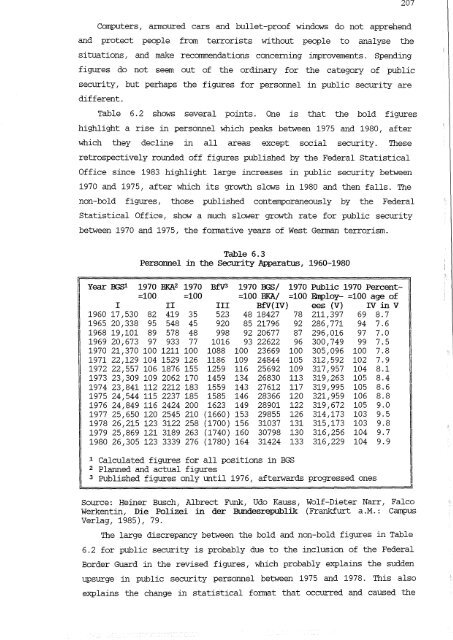
207 Computers, armoured cars and bullet-proof windows do not apprehend and protect people from terrorists without people to analyse the situations, and make recommendations concerning improvements. Spending figures do not seem out of the ordinary for the category of public security, but perhaps the figures for personnel in public security are different. Table 6.2 shows several points. One is that the bold figures highlight a rise in personnel which peaks between 1975 and 1980, after which they decline in all areas except social security. These retrospectively rounded off figures published by the Federal Statistical Office since 1983 highlight large increases in public security between 1970 and 1975, after which its growth slaws in 1980 and then falls. The non-bold figures, those published contemporaneously by the Federal Statistical Office, shaw a much slower growth rate for public security between 1970 and 1975, the formative years of West German terrorism. Table 6.3 Personnel in the Security Apparatus I 1960-1980 II 11 Year BGSl 1970 BKA2 1970 BfV3 1970 IDS/ 1970 Public 1970 Percent- =100 =100 =100 BKA/ =100 Emplay- =100 age of I II III BfV(IV) ees (V) IV in V 1960 17,530 82 419 35 523 48 18427 78 211,397 69 8.7 1965 20,338 95 548 45 920 85 21796 92 286,771 94 7.6 1968 19,101 89 578 48 998 92 20677 87 296,016 97 7.0 1969 20,673 97 933 77 1016 93 22622 96 300,749 99 7.5 1970 21;370 100 1211 100 1088 100 23669 100 305,096 100 7.8 1971 22,129 104 1529 126 1186 109 24844 105 312,592 102 7.9 1972 22,557 106 1876 155 1259 116 25692 109 317,957 104 8.1 1973 23,309 109 2062 170 1459 134 26830 113 319,263 105 8.4 1974 23 /841 112 2212 183 1559 143 27612 117 319,995 105 8.6 1975 24,544 115 2237 185 1585 146 28366 120 321;959 106 8.8 1976 24,849 116 2424 200 1623 149 28901 122 319,672 105 9.0 1977 25,650 120 2545 210 (1660) 153 29855 126 314,173 103 9.5 1978 26,215 123 3122 258 (1700) 156 31037 131 315,173 103 9.8 1979 25,869 121 3189 263 (1740) 160 30798 130 316,256 104 9.7 1980 26,305 123 3339 276 (1780) 164 31424 133 316,229 104 9.9 1 Calculated figures for all positions in BGS 2 Planned and actual figures 3 Published figures only until 1976, afterwards progressed ones Source: Heiner Busch, Albrect Funk, Udo Kauss I Wolf-Dieter Narr I Falco Werkentin, Die Polizei in der Blmdesrepublik (Frankfurt a.M.: Campus Verlag, 1985), 79. The large discrepancy between the bold and non-bold figures in Table 6.2 for public security is probably due to the inclusion of the Federal Border Guard in the revised figures, which probably explains the sudden upsurge in public security personnel between 1975 and 1978. This also explains the change in statistical format that occurred and caused the
208 holes in the table. A view of Table 6.3 shows that although the figures differ for total public personnel, the rises are similar in volume. Table 6.3 also explains that between 1975 and 1978 the percentage of people in public security only moved from 8.8% to 9.8% which is consistent with the <strong>thesis</strong> that other unaccounted personnel were not included in Table 6.2 before 1978. Table 6.4 Laender Personnel in Public Service, 1964-1988 Year 1950 1960 1964 1969 1970 1970 1971 1972 1973 1974 1975 1975 1976 1977 1978 1979 1980 1/ 1980 Total 722,200 949 r600 977 ,071 1,111,285 lr209,900 1,154,193 1,213,347 1,269[771 1,383,753 1,376,293 1,440,,200 1,403,291 1,494,284 1,439,102 1,680,380 1,741,082 1,567,900 1,666,074 Public Security 94,000 118rOOO 122,788 135,650 144,500 144,468 147,630 156,072 168,572 175 r600 175,567 185,715 199,674 207,222 204,500 209,797 Legal Aid 69 rOOO 91,800 96,556 88,403 104r900 104,884 106,397 113,973 113,973 115,900 115,933 115,320 127,611 133,454 123,500 136,484 Educa- Social tian Security 204 r 000 46,000 I' 295 r800 55,700 279,309 46,488 I 345,383 44,990 II 487,100 46,200 491,129 46,226 533,359 48,026 569,698 48,319 615,022 635,100 458,192 478,986 594,970 618,401 713,000 622,352 50,343 49,500 49,514 49,641 58,351 60,911 51,100 60,540 1\1 x1970 x1970 1.30 1.44 1.42 1.45 1.18 1.36 1.46 1.16 1.11 1.31 1981 1,658,987 1982 1,668,611 1983 1,586,500 1984 1985 1986 1987 1988 1,571/700 l r559,800 1 /548,300 1,538,100 214,100 215,456 212,000 211,800 211,700 211,600 211,500 140,600 143,061 131,600 135,400 136,500 138r500 139 r700 630,700 646,712 718,700 694,800 681,400 669,900 659,700 59,150 59,699 51,700 52,000 49,600 49,600 49,500 I x1980 0.98 x1980 0.92 1.03 1.01 1.13 1.02 0.93 1.06 0.97 0.81 '\ NOTE: The bold figures are rounded off to exclude those on vacation by a considerable degree as is seen when they are compared to the other figures for contemporary years that were originally published. Source: Stati tisches Bundesarnt, Statistisches Jahrbuch fuer die B\mdesrepublik Deutschland volumes 1965-1990 (Wiesbaden: W. Kohlharnrner, 1965), 453; 1971, 406; 1972, 411; 1973, 424; 1974, 411; 1975, 412; 1976, 419; 1977, 405; 1978, 422; 1979, 421; 1980, 416; 1981, 429; 1982, 433; 1983, 431; 1984, 440; 1990, 459.
- Page 1 and 2:
LEFT-WING TERRORISM IN THE FEDERAL
- Page 3 and 4:
ABSTRACT The Federal Republic of Ge
- Page 5 and 6:
i v In submitting this thesis to th
- Page 7 and 8:
The completion of a project of this
- Page 9 and 10:
V.J...J...J.. Chapter Three: Left-W
- Page 11 and 12:
List of Figures 1.1 Identification
- Page 13 and 14:
XLI. OPEC PFLP PIOS RAF RZ Rote AIm
- Page 15 and 16:
A.J..V Preface This thesis deals wi
- Page 17 and 18:
2 Both the historical and analytica
- Page 19 and 20:
4 left.7 This tradition continued i
- Page 21 and 22:
6 terrorism in the Federal Republic
- Page 23 and 24:
8 The result is that terrorism rese
- Page 25 and 26:
10 (particulary murder f killing, e
- Page 27 and 28:
12 government has to take the terro
- Page 29 and 30:
14 The concept of identification us
- Page 31 and 32:
, , /1 sow.et:iJ1~s ~een tp a~t ()n
- Page 33 and 34:
18 CHAPTER TWO: LEFT-WING TERRORISM
- Page 35 and 36:
20 Third World liberation movements
- Page 37 and 38:
22 and its continuation should not
- Page 39 and 40:
awareness. Fifth, the idea to form
- Page 41 and 42:
26 was that 'late capitalism' neede
- Page 43 and 44:
28 In this kind of atmosphere an as
- Page 45 and 46:
30 vacuum some spontis fonned land
- Page 47 and 48:
32 2.12 Second Phase, 1970-1972 The
- Page 49 and 50:
34 The first of the follow-on group
- Page 51 and 52:
attacks against imperialist counter
- Page 53 and 54:
38 March 1968 shortly before Baader
- Page 55 and 56:
40 Schmuecker was a group member be
- Page 57 and 58:
42 2.3 Revolutionary Cells The Revo
- Page 59 and 60:
44 This group operated internationa
- Page 61 and 62:
46 Money, weapons, training and saf
- Page 63 and 64:
48 were not heroic and they signall
- Page 65 and 66:
50 integrated into the RAF prisoner
- Page 67 and 68:
52 Palestine to Western Europe [ wh
- Page 69 and 70:
justified their claim to be an inte
- Page 71 and 72:
act for their awn ideas of organisa
- Page 73 and 74:
four Second of June members were ar
- Page 75 and 76:
60 The effect of these Red Army Fac
- Page 77 and 78:
stated that the prisoners must be b
- Page 79 and 80:
64 on hunger strike more often and
- Page 81 and 82:
66 3.4 The Revolutionary Cells The
- Page 83 and 84:
3.5 Autonanen Amidst the radicalisa
- Page 85 and 86:
70 hierachical RAF and its indoctri
- Page 87 and 88:
72 maintain their illegal/legal exi
- Page 89 and 90:
average 36.7%, 1980s), which were h
- Page 91 and 92:
amounted to $22. 5 million in ranso
- Page 93 and 94:
public may see models for their own
- Page 95 and 96:
80 between them, while others chang
- Page 97 and 98:
82 between imperialistic authori ti
- Page 99 and 100:
84 a stand collapes, be little surp
- Page 101 and 102:
86 needs South Africa to be under W
- Page 103 and 104:
88 3.3 Technology The technology as
- Page 105 and 106:
90 judges [abuse/violate] their sex
- Page 107 and 108:
92 3.51 Release of Prisoners Identi
- Page 109 and 110:
prisoners. Creating an elitist grou
- Page 111 and 112:
96 activities that placed the outsi
- Page 113 and 114:
98 call for the 'consolidation of p
- Page 115 and 116:
100 More important for the RAF, how
- Page 117 and 118:
publicity than would have otherwise
- Page 119 and 120:
104 factors involved in operational
- Page 121 and 122:
106 and biographical processes call
- Page 123 and 124:
-: ........ ;:; .1.VO IT~els, both
- Page 125 and 126:
110 person's 10ng-teDm function~lg.
- Page 127 and 128:
112 The possibility of a death-wish
- Page 129 and 130:
114 responsibility" to the extent o
- Page 131 and 132:
116 nie ag~Legate exterr~l variable
- Page 133 and 134:
811 J .P1=ql= ~~ "6-8 '(1861) u~eT~
- Page 135 and 136:
()7T vt,.. ;... 0601 lupJ~ l~otLE~
- Page 137 and 138:
122 such situations adds further we
- Page 139 and 140:
124 3. The Individual in West Genna
- Page 141 and 142:
126 disturbances. This supports the
- Page 143 and 144:
Table 4.1 Demographic Profile of th
- Page 145 and 146:
ebuild and maintain their material
- Page 147 and 148:
132 socialisation. 104 The developm
- Page 149 and 150:
134 Table 4.5 Biographical OcCUITan
- Page 151 and 152:
136 questioning about oneself and t
- Page 153 and 154:
oles and norms and offered a possib
- Page 155 and 156:
person feels less experienced and i
- Page 157 and 158:
142 Table 4.7 (page 143) shows that
- Page 159 and 160:
144 Table 4.8 Group Affiliations of
- Page 161 and 162:
146 A person's perceived level of a
- Page 163 and 164:
148 possibilities of legal extra-pa
- Page 165 and 166:
150 When the person joined because
- Page 167 and 168:
152 for a new identity which contra
- Page 169 and 170:
154 Three theoretical approaches ar
- Page 171 and 172: 156 cohesion, instead of lessening
- Page 173 and 174: 158 destructive group. The counterm
- Page 175 and 176: 160 interested in sociopolitical af
- Page 177 and 178: 162 addition of fantasy to their be
- Page 179 and 180: 164 to political groups. The person
- Page 181 and 182: 166 links with the legals (lawyers,
- Page 183 and 184: 168 1984 or 1985. 65 Then only the
- Page 185 and 186: 170 3.1. Group Benefits and Enterin
- Page 187 and 188: 172 Aid committee work had been in
- Page 189 and 190: 174 Constitution at the time. The S
- Page 191 and 192: 176 As mentioned earlier, a person'
- Page 193 and 194: 178 feelings of resignation and irr
- Page 195 and 196: 180 together making it liable to co
- Page 197 and 198: 182 goals, but will not always rela
- Page 199 and 200: 184 a social revolution { which is
- Page 201 and 202: 186 groups, but upon Baader's insis
- Page 203 and 204: 188 might reflect badly on the publ
- Page 205 and 206: 190 The effectiveness of any dissen
- Page 207 and 208: 192 Leaving one terrorist organisat
- Page 209 and 210: 194 Cells and Alltonamen belong to
- Page 211 and 212: 196 of the relationship between the
- Page 213 and 214: 198 which views the justification o
- Page 215 and 216: 200 public interests when the dange
- Page 217 and 218: 202 policy must be to foster identi
- Page 219 and 220: 204 the government did arrive at an
- Page 221: 206 between projected and actual co
- Page 225 and 226: 210 and the police hierarchy that l
- Page 227 and 228: 212 first suspected terrorists push
- Page 229 and 230: 214 turn a multinational effort to
- Page 231 and 232: 216 7,265 to 14,073. However, these
- Page 233 and 234: 218 Beneath the BRA and LKAs are re
- Page 235 and 236: 220 response to the Munich Massacre
- Page 237 and 238: 222 everything th~ prison and court
- Page 239 and 240: 224 These changes in early 1976, al
- Page 241 and 242: 4. Strengths and Limitations of Cou
- Page 243 and 244: 228 did not hang over them. They we
- Page 245 and 246: 230 Preparations, on the other hand
- Page 247 and 248: 232 arrest of Rolf Heissler in 1979
- Page 249 and 250: country and count the life, health
- Page 251 and 252: 236 StGB may only push terrorist sy
- Page 253 and 254: 238 only prevent future acti vi ty
- Page 255 and 256: 240 issue. The Federal Prosecutor G
- Page 257 and 258: 242 Ideological groups can be destr
- Page 259 and 260: 244 to organise their efforts accor
- Page 261 and 262: 246 arrested suspects. This was the
- Page 263 and 264: 248 ignored the order because they
- Page 265 and 266: 250 years were less often sentenced
- Page 267 and 268: problems than it solved, because of
- Page 269 and 270: 254 and terrorism relationship. Bot
- Page 271 and 272: 256 'defence against subversion' in
- Page 273 and 274:
258 There is a large difference bet
- Page 275 and 276:
~bU indicate goals and stimulate as
- Page 277 and 278:
262 ground of innocent bystanders.
- Page 279 and 280:
264 and other activities. At that t
- Page 281 and 282:
266 using unbelievable amounts of e
- Page 283 and 284:
268 but rather develop themselves.
- Page 285 and 286:
270 be used if the public were conf
- Page 287 and 288:
272 South Yeman! Iraq and Vietnam,
- Page 289 and 290:
274 not. A month later, 50% had tho
- Page 291 and 292:
[/b or radio or television programm
- Page 293 and 294:
[I'd CHAPTER EIGHT: CONCLUSION The
- Page 295 and 296:
280 the sole option available to th
- Page 297 and 298:
as the person assimilated their pas
- Page 299 and 300:
~nprisonment. This could only bind
- Page 301 and 302:
286 Pre-terrorist group groups also
- Page 303 and 304:
elieved the benefits outweighed the
- Page 305 and 306:
The government assisted the rise of
- Page 307 and 308:
3. Practical Applications The conce
- Page 309 and 310:
way. They are wedded to an organisa
- Page 311 and 312:
prisoners and the active members, o
- Page 313 and 314:
298 CHRONOLCGY OF MAJOR EVENTS 2 Ju
- Page 315 and 316:
300 12 June 1974 (RZ): The Chilian
- Page 317 and 318:
5 January 1977 (RAP): Christian Kla
- Page 319 and 320:
304 17 November 1978 (RAP): Peter-J
- Page 321 and 322:
6 September 1985 (RAF): Illegal mil
- Page 323 and 324:
6 June 1990 (RAP): SUsanne Albrecht
- Page 325 and 326:
310 Alexander I Yonah, Katwan Jakov
- Page 327 and 328:
Boelsche, Jochen. "Das Strahlnetz s
- Page 329 and 330:
314 "The Logic of Terrorism: Terror
- Page 331 and 332:
Geronimo (pseudonym). Feuer und Fla
- Page 333 and 334:
"Der Verfall der Roten AImee Frakti
- Page 335 and 336:
Krumm, Karl-Heinz. "Terrorbekaempfu
- Page 337 and 338:
Passerini, Luisa. "Mythobiography i
- Page 339 and 340:
Verlagsgesellschaft politische Beri
- Page 341 and 342:
326 Sartre, Jean-Paul. Critique of
- Page 343 and 344:
328 , P.A. Fleming. "Terrorism and
- Page 345:
330 PERIODICALS Angehoerigen Info (