

Improved Beta? - IndexUniverse.com
Improved Beta? - IndexUniverse.com
Improved Beta? - IndexUniverse.com

Create successful ePaper yourself
Turn your PDF publications into a flip-book with our unique Google optimized e-Paper software.
of risk/reward efficiency, three of the noncap-weighted<br />
indexes have significantly higher Sharpe ratios than the<br />
cap-weighted S&P 500.<br />
It is useful to give some intuition on the statistical significance<br />
levels shown in Figure 2. For the Sharpe ratio, the<br />
efficient index has the most significant increase over the capweighted<br />
S&P 500, with a probability value of 0.2 percent.<br />
What this means is that, if there were no true difference<br />
in the Sharpe ratio with the cap-weighted S&P 500 index,<br />
we would expect to observe a difference as pronounced as<br />
the one we observed (i.e., 0.28) about one out of every 500<br />
times we look at a data set of 11 years. The probability values<br />
for the fundamental index and the equal-weighted index are<br />
on the order of 1 to 3 percent; hence it would also be highly<br />
unlikely to obtain such results if there were no true difference.<br />
To summarize the results that are statistically significant,<br />
we can conclude that—<strong>com</strong>pared to the cap-weighted<br />
S&P 500—minimum-volatility indexes have lower volatility<br />
and the other noncap-weighted indexes have higher average<br />
returns and higher Sharpe ratios.<br />
Factor Exposures<br />
The analysis of risk and return measures yields insights<br />
into how the indexes behave, which is obviously important<br />
information for investors. However, it is also interesting to<br />
analyze where the return properties <strong>com</strong>e from. The noncapweighted<br />
indexes may take on exposures to <strong>com</strong>mon risk<br />
factors that are well-known in academic finance literature,<br />
such as value, momentum and small-cap exposures.<br />
Since the indexes are broadly diversified across constituent<br />
stocks, one may in fact expect that the risk and return<br />
properties are largely driven by such factor exposures, leaving<br />
only a small fraction of returns that are <strong>com</strong>pletely specific<br />
to the method of index design. From the investor’s perspective,<br />
such risk exposures matter. They are often implicit<br />
results of portfolio construction, but investors want to know<br />
how exposed they are to certain factors.<br />
In this section, we use factor models to analyze exposure<br />
to the equity factors <strong>com</strong>monly used in academic literature.<br />
The standard factor models in the empirical finance<br />
literature use a market risk factor, which is made up of all<br />
stocks that are traded on the U.S. market and additional<br />
factors that are long/short portfolios, rebalanced monthly,<br />
of stocks that have been selected from this universe for<br />
their style characteristics. In our empirical analysis, we use<br />
the standard four-factor model (Carhart [1997]), in which<br />
we regress the returns in excess of the risk-free rate of the<br />
indexes on the excess returns of the cap-weighted index<br />
of all stocks listed on the NYSE, NYSE Amex and Nasdaq,<br />
on the Fama-French [1992] factors for the value and smallcap<br />
premium, and on an additional factor representing a<br />
momentum strategy. In terms of the Fama-French factors,<br />
the value factor is a portfolio that is long high book-to-price<br />
stocks (value stocks) and short low book-to-price stocks<br />
(growth stocks), while the small-cap factor is a portfolio<br />
that is long low market-cap stocks (small stocks) and short<br />
high market-cap stocks (large stocks). The momentum factor<br />
goes long in stocks with high recent returns (winners)<br />
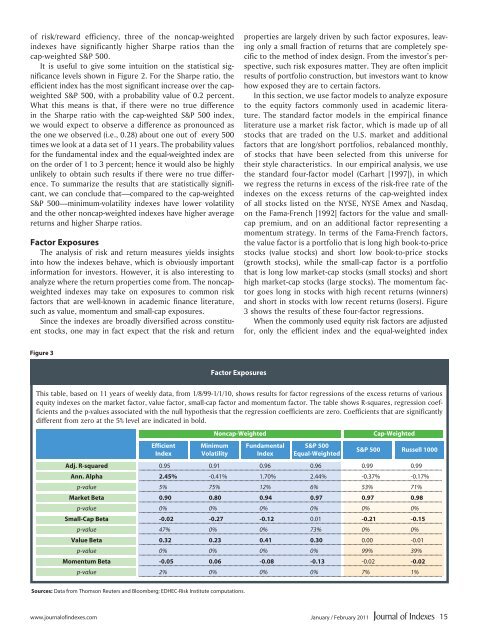
and short in stocks with low recent returns (losers). Figure<br />
3 shows the results of these four-factor regressions.<br />
When the <strong>com</strong>monly used equity risk factors are adjusted<br />
for, only the efficient index and the equal-weighted index<br />
Figure 3<br />
Factor Exposures<br />
This table, based on 11 years of weekly data, from 1/8/99-1/1/10, shows results for factor regressions of the excess returns of various<br />
equity indexes on the market factor, value factor, small-cap factor and momentum factor. The table shows R-squares, regression coefficients<br />
and the p-values associated with the null hypothesis that the regression coefficients are zero. Coefficients that are significantly<br />
different from zero at the 5% level are indicated in bold.<br />
Efficient<br />
Index<br />
Noncap-Weighted<br />
Minimum<br />
Volatility<br />
Fundamental<br />
Index<br />
S&P 500<br />
Equal-Weighted<br />
Cap-Weighted<br />
S&P 500 Russell 1000<br />
Adj. R-squared 0.95 0.91 0.96 0.96 0.99 0.99<br />
Ann. Alpha 2.45% -0.41% 1.70% 2.44% -0.37% -0.17%<br />
p-value 5% 75% 12% 6% 53% 71%<br />
Market <strong>Beta</strong> 0.90 0.80 0.94 0.97 0.97 0.98<br />
p-value 0% 0% 0% 0% 0% 0%<br />
Small-Cap <strong>Beta</strong> -0.02 -0.27 -0.12 0.01 -0.21 -0.15<br />
p-value 47% 0% 0% 73% 0% 0%<br />
Value <strong>Beta</strong> 0.32 0.23 0.41 0.30 0.00 -0.01<br />
p-value 0% 0% 0% 0% 99% 39%<br />
Momentum <strong>Beta</strong> -0.05 0.06 -0.08 -0.13 -0.02 -0.02<br />
p-value 2% 0% 0% 0% 7% 1%<br />
Sources: Data from Thomson Reuters and Bloomberg; EDHEC-Risk Institute <strong>com</strong>putations.<br />
www.journalofindexes.<strong>com</strong> January / February 2011<br />
15


