

Improved Beta? - IndexUniverse.com
Improved Beta? - IndexUniverse.com
Improved Beta? - IndexUniverse.com

Create successful ePaper yourself
Turn your PDF publications into a flip-book with our unique Google optimized e-Paper software.
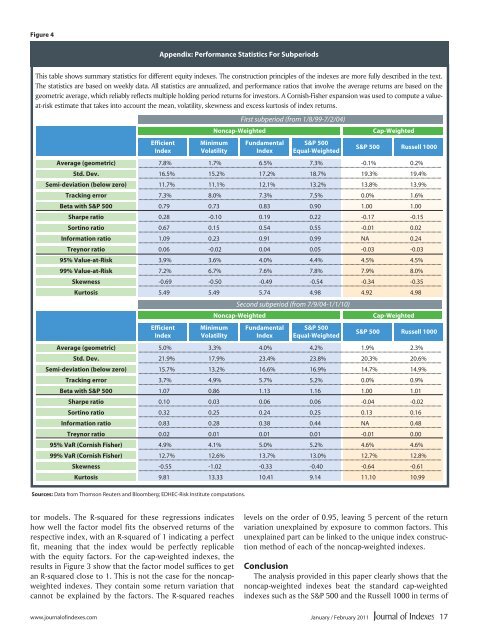
Figure 4<br />
Appendix: Performance Statistics For Subperiods<br />
This table shows summary statistics for different equity indexes. The construction principles of the indexes are more fully described in the text.<br />
The statistics are based on weekly data. All statistics are annualized, and performance ratios that involve the average returns are based on the<br />
geometric average, which reliably reflects multiple holding period returns for investors. A Cornish-Fisher expansion was used to <strong>com</strong>pute a valueat-risk<br />
estimate that takes into account the mean, volatility, skewness and excess kurtosis of index returns.<br />
Efficient<br />
Index<br />
Minimum<br />
Volatility<br />
Sources: Data from Thomson Reuters and Bloomberg; EDHEC-Risk Institute <strong>com</strong>putations.<br />
Fundamental<br />
Index<br />
S&P 500<br />
Equal-Weighted<br />
S&P 500 Russell 1000<br />
Average (geometric) 7.8% 1.7% 6.5% 7.3% -0.1% 0.2%<br />
Std. Dev. 16.5% 15.2% 17.2% 18.7% 19.3% 19.4%<br />
Semi-deviation (below zero) 11.7% 11.1% 12.1% 13.2% 13.8% 13.9%<br />
Tracking error 7.3% 8.0% 7.3% 7.5% 0.0% 1.6%<br />
<strong>Beta</strong> with S&P 500 0.79 0.73 0.83 0.90 1.00 1.00<br />
Sharpe ratio 0.28 -0.10 0.19 0.22 -0.17 -0.15<br />
Sortino ratio 0.67 0.15 0.54 0.55 -0.01 0.02<br />
Information ratio 1.09 0.23 0.91 0.99 NA 0.24<br />
Treynor ratio 0.06 -0.02 0.04 0.05 -0.03 -0.03<br />
95% Value-at-Risk 3.9% 3.6% 4.0% 4.4% 4.5% 4.5%<br />
99% Value-at-Risk 7.2% 6.7% 7.6% 7.8% 7.9% 8.0%<br />
Skewness -0.69 -0.50 -0.49 -0.54 -0.34 -0.35<br />
Kurtosis 5.49 5.49 5.74 4.98 4.92 4.98<br />
Efficient<br />
Index<br />
Noncap-Weighted<br />
Minimum<br />
Volatility<br />
First subperiod (from 1/8/99-7/2/04)<br />
Second subperiod (from 7/9/04-1/1/10)<br />
Noncap-Weighted<br />
Fundamental<br />
Index<br />
S&P 500<br />
Equal-Weighted<br />
Cap-Weighted<br />
Cap-Weighted<br />
S&P 500 Russell 1000<br />
Average (geometric) 5.0% 3.3% 4.0% 4.2% 1.9% 2.3%<br />
Std. Dev. 21.9% 17.9% 23.4% 23.8% 20.3% 20.6%<br />
Semi-deviation (below zero) 15.7% 13.2% 16.6% 16.9% 14.7% 14.9%<br />
Tracking error 3.7% 4.9% 5.7% 5.2% 0.0% 0.9%<br />
<strong>Beta</strong> with S&P 500 1.07 0.86 1.13 1.16 1.00 1.01<br />
Sharpe ratio 0.10 0.03 0.06 0.06 -0.04 -0.02<br />
Sortino ratio 0.32 0.25 0.24 0.25 0.13 0.16<br />
Information ratio 0.83 0.28 0.38 0.44 NA 0.48<br />
Treynor ratio 0.02 0.01 0.01 0.01 -0.01 0.00<br />
95% VaR (Cornish Fisher) 4.9% 4.1% 5.0% 5.2% 4.6% 4.6%<br />
99% VaR (Cornish Fisher) 12.7% 12.6% 13.7% 13.0% 12.7% 12.8%<br />
Skewness -0.55 -1.02 -0.33 -0.40 -0.64 -0.61<br />
Kurtosis 9.81 13.33 10.41 9.14 11.10 10.99<br />
tor models. The R-squared for these regressions indicates<br />
how well the factor model fits the observed returns of the<br />
respective index, with an R-squared of 1 indicating a perfect<br />
fit, meaning that the index would be perfectly replicable<br />
with the equity factors. For the cap-weighted indexes, the<br />
results in Figure 3 show that the factor model suffices to get<br />
an R-squared close to 1. This is not the case for the noncapweighted<br />
indexes. They contain some return variation that<br />
cannot be explained by the factors. The R-squared reaches<br />
levels on the order of 0.95, leaving 5 percent of the return<br />
variation unexplained by exposure to <strong>com</strong>mon factors. This<br />
unexplained part can be linked to the unique index construction<br />
method of each of the noncap-weighted indexes.<br />
Conclusion<br />
The analysis provided in this paper clearly shows that the<br />
noncap-weighted indexes beat the standard cap-weighted<br />
indexes such as the S&P 500 and the Russell 1000 in terms of<br />
www.journalofindexes.<strong>com</strong> January / February 2011<br />
17


