

Improved Beta? - IndexUniverse.com
Improved Beta? - IndexUniverse.com
Improved Beta? - IndexUniverse.com

You also want an ePaper? Increase the reach of your titles
YUMPU automatically turns print PDFs into web optimized ePapers that Google loves.
index consistently has lower volatility than the CEW index.<br />
The Russell CEW 1000 index has significantly higher volatility<br />
than the other two indexes from 2002 to 2005, deviating<br />
as much as 3 percent from the SEW index.<br />
In contrast, as we show in Figure 9, the Russell 2000 capweight<br />
index does not consistently display lower volatility<br />
than the Russell 2000 SEW. The SEW index shows lower<br />
volatility than the cap-weighted indexes from 1982 to 1993<br />
and during the technology boom-and-bust period, while the<br />
cap-weighted indexes have lower volatility for much of the<br />
current decade. There is no significant period of time during<br />
which the CEW index has lower volatility than the capweighted<br />
index or the SEW index.<br />
We observed similar return and risk characteristics when<br />
we tested the SEW and CEW methodologies based on the<br />
Russell Global indexes. The SEW index consistently outperformed<br />
the CEW index, with lower volatility.<br />
Risk-Adjusted Returns<br />
The Russell SEW indexes have outperformed capweighted<br />
indexes over the entire period under review<br />
(1/1/1979-6/30/2010) in the domestic U.S. indexes and in<br />
international markets. However, the outperformance was<br />
ac<strong>com</strong>panied by higher volatility.<br />
We present Sharpe ratios over three time periods for the<br />
Russell 1000, 2000 and 3000 Indexes for the cap-weighted,<br />
SEW and CEW indexes (see Figure 10). With the exception of<br />
the Russell 2000, over the longest sample time period (1979<br />
to June 2010), the risk-adjusted returns for the SEW were<br />
higher than for the cap-weighted and CEW indexes.<br />
For the period 1996 to 2010, which includes the outperformance<br />
of cap-weighted indexes during the technology<br />
boom, absolute returns and Sharpe ratios are higher<br />
for the SEW indexes.<br />
Where Is the Outperformance Coming From?<br />
To analyze where the outperformance of the SEW indexes<br />
is <strong>com</strong>ing from and to gain additional insight, we perform a<br />
Fama-French three-factor regression analysis and calculate<br />
contribution to returns by sector and size.<br />
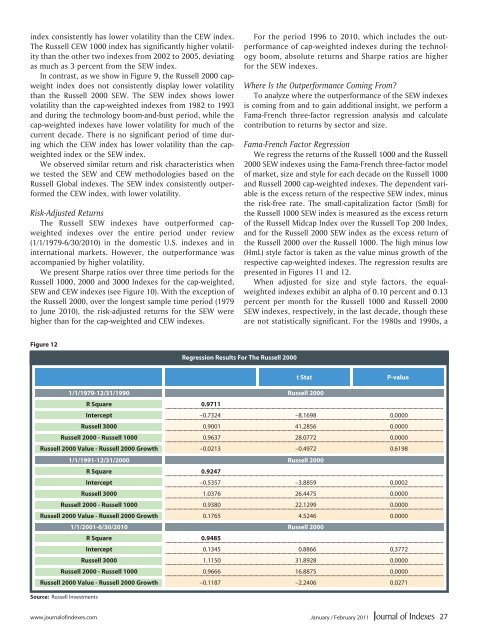
Fama-French Factor Regression<br />
We regress the returns of the Russell 1000 and the Russell<br />
2000 SEW indexes using the Fama-French three-factor model<br />
of market, size and style for each decade on the Russell 1000<br />
and Russell 2000 cap-weighted indexes. The dependent variable<br />
is the excess return of the respective SEW index, minus<br />
the risk-free rate. The small-capitalization factor (SmB) for<br />
the Russell 1000 SEW index is measured as the excess return<br />
of the Russell Midcap Index over the Russell Top 200 Index,<br />
and for the Russell 2000 SEW index as the excess return of<br />
the Russell 2000 over the Russell 1000. The high minus low<br />
(HmL) style factor is taken as the value minus growth of the<br />
respective cap-weighted indexes. The regression results are<br />
presented in Figures 11 and 12.<br />
When adjusted for size and style factors, the equalweighted<br />
indexes exhibit an alpha of 0.10 percent and 0.13<br />
percent per month for the Russell 1000 and Russell 2000<br />
SEW indexes, respectively, in the last decade, though these<br />
are not statistically significant. For the 1980s and 1990s, a<br />
Figure 12<br />
Regression Results For The Russell 2000<br />
Trading<br />
Symbol<br />
t Stat<br />
1/1/1979-12/31/1990 Russell 2000<br />
R Square 0.9711<br />
P-value<br />
Intercept –0.7324 –8.1698 0.0000<br />
Russell 3000 0.9001 41.2856 0.0000<br />
Russell 2000 - Russell 1000 0.9637 28.0772 0.0000<br />
Russell 2000 Value - Russell 2000 Growth –0.0213 –0.4972 0.6198<br />
1/1/1991-12/31/2000 Russell 2000<br />
R Square 0.9247<br />
Intercept –0.5357 –3.8859 0.0002<br />
Russell 3000 1.0376 26.4475 0.0000<br />
Russell 2000 - Russell 1000 0.9380 22.1299 0.0000<br />
Russell 2000 Value - Russell 2000 Growth 0.1765 4.5246 0.0000<br />
1/1/2001-6/30/2010 Russell 2000<br />
R Square 0.9485<br />
Intercept 0.1345 0.8866 0.3772<br />
Russell 3000 1.1150 31.8928 0.0000<br />
Russell 2000 - Russell 1000 0.9666 16.8875 0.0000<br />
Russell 2000 Value - Russell 2000 Growth –0.1187 –2.2406 0.0271<br />
Source: Russell Investments<br />
www.journalofindexes.<strong>com</strong> January / February 2011<br />
27


