

Improved Beta? - IndexUniverse.com
Improved Beta? - IndexUniverse.com
Improved Beta? - IndexUniverse.com

You also want an ePaper? Increase the reach of your titles
YUMPU automatically turns print PDFs into web optimized ePapers that Google loves.
strategies. Past research by Blanchett [2010] has noted that<br />
indexes have varying factor exposures that have a significant<br />
impact on performance. For the second test, the returns of<br />
each index are <strong>com</strong>pared against a market-factor-adjusted<br />
portfolio, and then to each other. The market-factor-adjusted<br />
portfolio was determined based on a single four-factor (i.e.,<br />
Carhart) regression over the entire period of monthly returns.<br />
This approach removes any potential tilts an index may have<br />
that would skew its raw performance (e.g., it has a Small tilt<br />
and/or Value tilt). All data for the beta factors, as well as the<br />
risk-free rate, was obtained from Kenneth French’s website.<br />
For the four-factor regression, the excess return of the<br />
index (which is defined as the return of the index for the<br />
month minus the risk-free rate for the month) is regressed<br />
against a Market <strong>Beta</strong> factor (defined as the return on the<br />
market minus the risk-free rate); a Value factor (or HML,<br />
defined as the return on Value stocks minus the return on<br />
Growth stocks); a Size factor (or SMB, defined as the return<br />
on Small stocks minus the return on Big stocks); and a<br />
Momentum factor (based on the six value-weight portfolios<br />
formed on size and prior two- to 12-month returns, the average<br />
return on the two high prior-return portfolios minus the<br />
average return on the two low prior-return portfolios). The<br />
four-factor regression equation is:<br />
R index<br />
– R f<br />
= A index<br />
+ B index<br />
(R market<br />
– R f<br />
) + B SMB<br />
(SMB) +<br />
B HML<br />
(HML) + B MOM<br />
(Momentum) + E asset<br />
Where R index<br />
is the return on the index, R f<br />
is the risk-free rate,<br />
A index<br />
is the alpha of the index, B index<br />
is the index’s beta with<br />
respect to the market, R market<br />
is the return of the market, B SMB<br />
is<br />
the index’s beta with respect to the “Large” factor (SMB), B HML<br />
is the index’s beta with respect to the “Value” factor (HML),<br />
B MOM<br />
is the index’s beta with respect to the “Momentum” factor<br />
(MOM) and E asset<br />
is the error term. For those readers not<br />
familiar with the four-factor regression approach, see Fama<br />
and French [1993] and Carhart [1997].<br />
Cremers, Petajisto and Zitzewitz [2008] have noted that the<br />
standard Fama-French (three-factor) and Carhart (four-factor)<br />
regression models can produce statistically significant nonzero<br />
alphas for passive indexes primarily from the disproportionate<br />
weight the Fama-French factors place on Small Value stocks<br />
(which have performed well). While Cremers et al. introduce<br />
regression factors that outperform standard models in their<br />
paper, the traditional four-factor estimates are used for this<br />
research, due to their widespread use and acceptance.<br />
The regression factors for the nine test indexes are<br />
included in Appendix I. Note that only the Morningstar Core<br />
indexes had positive intercepts for the each of the three<br />
indexes (i.e., positive monthly alpha). Morningstar Blend<br />
had negative intercepts for Large Cap and Small Cap, while<br />
Russell had a negative intercept for Small Cap that was quite<br />
large in absolute terms, of -0.24 percent (with a t-statistic of<br />
-2.81). The R² values are higher for Morningstar Blend and<br />
Russell than for Morningstar Core. This should not be surprising<br />
given the factors are constructed using broad marketcap<br />
indexes (most similar to the Wilshire 5000) that are more<br />
similar to a Blend approach than a Core approach.<br />
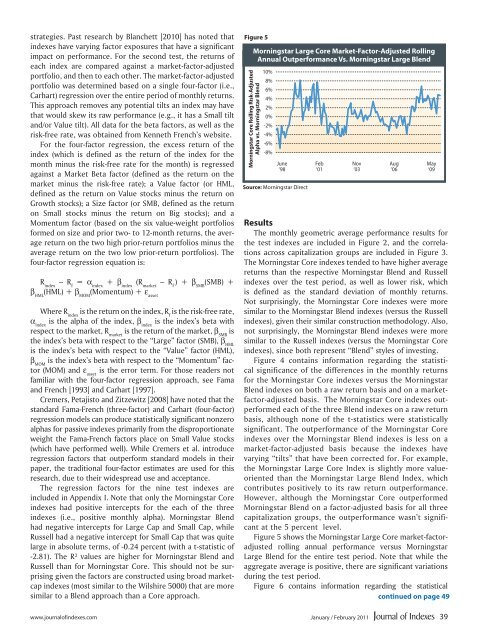
Figure 5<br />
Morningstar Large Core Market-Factor-Adjusted Rolling<br />
Annual Outperformance Vs. Morningstar Large Blend<br />
Morningstar Core Rolling Risk-Adjusted<br />
Alpha vs. Morningstar Blend<br />
10%<br />
8%<br />
6%<br />
4%<br />
2%<br />
0%<br />
-2%<br />
-4%<br />
-6%<br />
-8%<br />
June<br />
‘98<br />
Source: Morningstar Direct<br />
Feb<br />
‘01<br />
Results<br />
The monthly geometric average performance results for<br />
the test indexes are included in Figure 2, and the correlations<br />
across capitalization groups are included in Figure 3.<br />
The Morningstar Core indexes tended to have higher average<br />
returns than the respective Morningstar Blend and Russell<br />
indexes over the test period, as well as lower risk, which<br />
is defined as the standard deviation of monthly returns.<br />
Not surprisingly, the Morningstar Core indexes were more<br />
similar to the Morningstar Blend indexes (versus the Russell<br />
indexes), given their similar construction methodology. Also,<br />
not surprisingly, the Morningstar Blend indexes were more<br />
similar to the Russell indexes (versus the Morningstar Core<br />
indexes), since both represent “Blend” styles of investing.<br />
Figure 4 contains information regarding the statistical<br />
significance of the differences in the monthly returns<br />
for the Morningstar Core indexes versus the Morningstar<br />
Blend indexes on both a raw return basis and on a marketfactor-adjusted<br />
basis. The Morningstar Core indexes outperformed<br />
each of the three Blend indexes on a raw return<br />
basis, although none of the t-statistics were statistically<br />
significant. The outperformance of the Morningstar Core<br />
indexes over the Morningstar Blend indexes is less on a<br />
market-factor-adjusted basis because the indexes have<br />
varying “tilts” that have been corrected for. For example,<br />
the Morningstar Large Core Index is slightly more valueoriented<br />
than the Morningstar Large Blend Index, which<br />
contributes positively to its raw return outperformance.<br />
However, although the Morningstar Core outperformed<br />
Morningstar Blend on a factor-adjusted basis for all three<br />
capitalization groups, the outperformance wasn’t significant<br />
at the 5 percent level.<br />
Figure 5 shows the Morningstar Large Core market-factoradjusted<br />
rolling annual performance versus Morningstar<br />
Large Blend for the entire test period. Note that while the<br />
aggregate average is positive, there are significant variations<br />
during the test period.<br />
Figure 6 contains information regarding the statistical<br />
continued on page 49<br />
Nov<br />
‘03<br />
Aug<br />
‘06<br />
May<br />
‘09<br />
www.journalofindexes.<strong>com</strong> January / February 2011 39


