

Improved Beta? - IndexUniverse.com
Improved Beta? - IndexUniverse.com
Improved Beta? - IndexUniverse.com

You also want an ePaper? Increase the reach of your titles
YUMPU automatically turns print PDFs into web optimized ePapers that Google loves.
mation is the number of stocks in the index. The basis of<br />
the equal-weighting approach is to assign a weight of 1/N<br />
to each security in an index, where N is the number of<br />
securities in the index.<br />
Assume, for example, that you “know” which security is<br />
going to be the best performer in the Russell 1000 Index.<br />
If you want the best return, you will hold only that security.<br />
If you diversify away from that future best-performing<br />
security by purchasing any other securities, you will not<br />
achieve the best possible return. But since most investors<br />
know they don’t have infallible foresight, they diversify<br />
in order to make sure they don’t own only the worstperforming<br />
security.<br />
Similar motivations for diversification have been noticed<br />
in some active managers’ portfolios. Some active managers,<br />
in an attempt to diversify across their holdings, tend not to<br />
weight their portfolios by market capitalization. As Fabozzi<br />
[1998] notes, “… managers tend to not capitalization-weight<br />
their portfolios for a variety of reasons. The most often cited<br />
reason is related to the manager’s aversion to putting too<br />
much money in any one basket (such as IBM)—they want<br />
stock name diversification.”<br />
While market-capitalization-weighted indexes provide<br />
diversification benefits by providing exposure to every<br />
security in the index, equal-weighting provides equal exposure<br />
to every <strong>com</strong>pany in the index. Figure 1 presents the<br />
weights represented by the Russell 1000 cap weight and<br />
the Russell 1000 constituent equal weight indexes, grouped<br />
by deciles of <strong>com</strong>pany size. The largest 10 percent of <strong>com</strong>panies<br />
account for 58 percent of the overall weight in the<br />
Russell 1000 cap weight index, <strong>com</strong>pared with just 10 percent<br />
of the overall weight in the Russell 1000 equal weight<br />
index. Equal-weight indexes provide equal exposure to<br />
every size decile of the index, while smaller-capitalization<br />
securities have very small weights in a cap-weighted index.<br />
The Russell Equal Weight Indexes<br />
The conventional approach to the construction of equalweighted<br />
indexes, however, brings with it issues such as<br />
inherent sector biases, potential capacity constraints/liquidity<br />
concerns, high turnover and rebalancing issues.<br />
Sector Biases<br />
An index with equal weights across all constituents (constituent<br />
equal weighting: CEW) will allocate significantly<br />
higher weights to some sectors than to others, embedding<br />
sector bias into the index.<br />
An alternative approach is to equal-weight sectors<br />
within an index. Figure 2 <strong>com</strong>pares the sector weights<br />
of the Russell 1000 cap-weighted index, the Russell 1000<br />
CEW index and the Russell 1000 SEW index as of January<br />
1, 2010. The technology, financial services and health care<br />
segments dominate the market-cap-weighted index, while<br />
financial services, producer durables and consumer discretionary<br />
sectors dominate the conventional equal-weighted<br />
variant, accounting for more than 50 percent of the index.<br />
The SEW approach evens this out, placing equal weights<br />
on each segment of the market.<br />
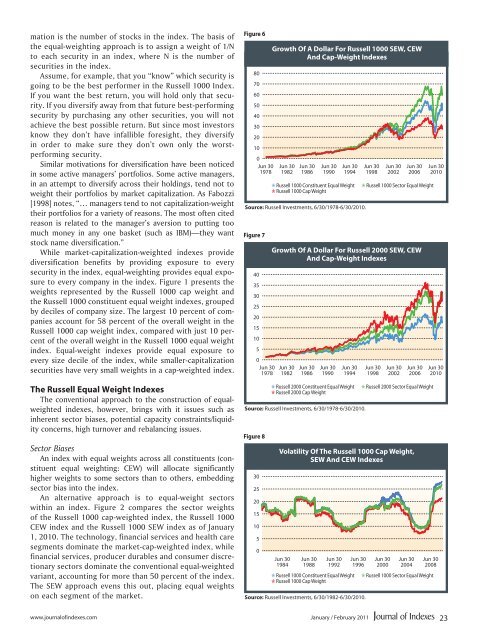
Figure 6<br />
80<br />
70<br />
60<br />
50<br />
40<br />
30<br />
20<br />
10<br />
Figure 7<br />
40<br />
35<br />
30<br />
25<br />
20<br />
15<br />
10<br />
5<br />
0<br />
Jun 30<br />
1978<br />
Growth Of A Dollar For Russell 2000 SEW, CEW<br />
And Cap-Weight Indexes<br />
Jun 30<br />
1982<br />
Jun 30<br />
1986<br />
Jun 30<br />
1990<br />
Jun 30<br />
1994<br />
N Russell 2000 Constituent Equal Weight<br />
N Russell 2000 Cap Weight<br />
Source: Russell Investments, 6/30/1978-6/30/2010.<br />
Figure 8<br />
0<br />
Jun 30<br />
1978<br />
30<br />
25<br />
20<br />
15<br />
10<br />
5<br />
0<br />
Growth Of A Dollar For Russell 1000 SEW, CEW<br />
And Cap-Weight Indexes<br />
Jun 30<br />
1982<br />
Jun 30<br />
1984<br />
Jun 30<br />
1986<br />
Jun 30<br />
1988<br />
Jun 30<br />
1990<br />
Jun 30<br />
1992<br />
Jun 30<br />
1994<br />
N Russell 1000 Constituent Equal Weight<br />
N Russell 1000 Cap Weight<br />
Source: Russell Investments, 6/30/1978-6/30/2010.<br />
Jun 30<br />
1996<br />
Jun 30<br />
1998<br />
Jun 30<br />
2002<br />
Jun 30<br />
2006<br />
N Russell 2000 Sector Equal Weight<br />
Volatility Of The Russell 1000 Cap Weight,<br />
SEW And CEW Indexes<br />
N Russell 1000 Constituent Equal Weight<br />
N Russell 1000 Cap Weight<br />
Source: Russell Investments, 6/30/1982-6/30/2010.<br />
Jun 30<br />
1998<br />
Jun 30<br />
2000<br />
Jun 30<br />
2002<br />
Jun 30<br />
2004<br />
Jun 30<br />
2006<br />
N Russell 1000 Sector Equal Weight<br />
Jun 30<br />
2010<br />
Jun 30<br />
2008<br />
N Russell 1000 Sector Equal Weight<br />
Jun 30<br />
2010<br />
www.journalofindexes.<strong>com</strong> January / February 2011<br />
23


