

Improved Beta? - IndexUniverse.com
Improved Beta? - IndexUniverse.com
Improved Beta? - IndexUniverse.com

Create successful ePaper yourself
Turn your PDF publications into a flip-book with our unique Google optimized e-Paper software.
Over the past few years, market observers have seen<br />
increased interest in indexes that use “alternative”<br />
weighting methodologies. While market-cap<br />
weighting is an excellent choice for benchmarks for active<br />
management and for the basis of investable products such<br />
as passive mutual funds, exchange-traded funds (ETFs),<br />
futures and options, investor interest in alternative index<br />
weighting methodologies, such as equal weighting and fundamental<br />
weighting, is growing.<br />
In this paper we provide an overview of some of these<br />
alternatives and a broader analysis of equal-weighted<br />
indexes. We first describe cap-weighted, fundamentalweighted<br />
and equal-weighted indexes and <strong>com</strong>pare their<br />
characteristics. We then discuss in greater detail the conventional<br />
equal-weighted index structure and review a new<br />
alternative to this method: the sector equal-weighted index<br />
methodology. We <strong>com</strong>pare and contrast the conventional<br />
equal-weighted methodology to the sector equal-weighted<br />
indexes and illustrate the benefits that a sector equalweighted<br />
index can provide. We then extend this analysis<br />
to the international indexes and analyze whether the characteristics<br />
observed in the domestic market persist.<br />
Based on our simulations, we find that:<br />
VËËÖ?ËÝj~Í~ËMßËWÄÍÍÖjÍÄ^ËÝjËĬjË?aËÍÁ?Äparent,<br />
introduces sector risk into an index.<br />
VËË.jWÍÁËjÖ?Ýj~ÍjaËajÞjÄˬÁÜajaË?ËMjÍÍjÁË?MÄlute<br />
return with lower volatility for the time period<br />
tested <strong>com</strong>pared to traditional equal-weighted and capweighted<br />
indexes.<br />
VËË0jÄjËÁjÄÖÍÄË?ÁjËWÄÄÍjÍË?WÁÄÄËÍjËajÄÍWË?Á~j<br />
cap, mid-cap and small-cap spectrum and the global<br />
developed and emerging regions.<br />
Figure 1<br />
Weight<br />
70%<br />
60%<br />
50%<br />
40%<br />
30%<br />
20%<br />
10%<br />
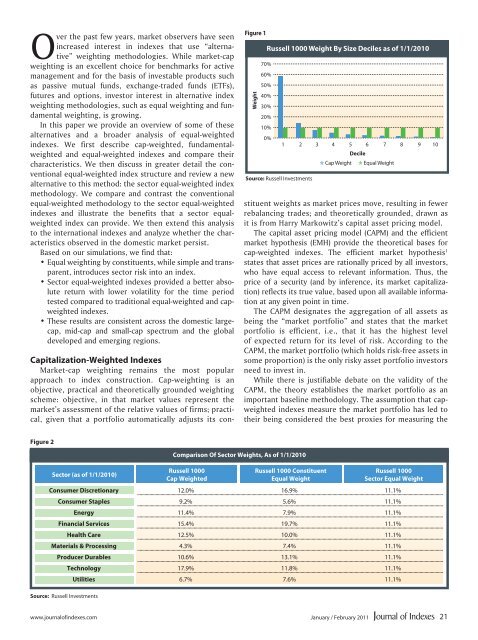
Russell 1000 Weight By Size Deciles as of 1/1/2010<br />
0%<br />
Source: Russell Investments<br />
1 2 3 4 5 6 7 8 9 10<br />
N Cap Weight<br />
Decile<br />
N Equal Weight<br />
Capitalization-Weighted Indexes<br />
Market-cap weighting remains the most popular<br />
approach to index construction. Cap-weighting is an<br />
objective, practical and theoretically grounded weighting<br />
scheme: objective, in that market values represent the<br />
market’s assessment of the relative values of firms; practical,<br />
given that a portfolio automatically adjusts its constituent<br />
weights as market prices move, resulting in fewer<br />
rebalancing trades; and theoretically grounded, drawn as<br />
it is from Harry Markowitz’s capital asset pricing model.<br />
The capital asset pricing model (CAPM) and the efficient<br />
market hypothesis (EMH) provide the theoretical bases for<br />
cap-weighted indexes. The efficient market hypothesis 1<br />
states that asset prices are rationally priced by all investors,<br />
who have equal access to relevant information. Thus, the<br />
price of a security (and by inference, its market capitalization)<br />
reflects its true value, based upon all available information<br />
at any given point in time.<br />
The CAPM designates the aggregation of all assets as<br />
being the “market portfolio” and states that the market<br />
portfolio is efficient, i.e., that it has the highest level<br />
of expected return for its level of risk. According to the<br />
CAPM, the market portfolio (which holds risk-free assets in<br />
some proportion) is the only risky asset portfolio investors<br />
need to invest in.<br />
While there is justifiable debate on the validity of the<br />
CAPM, the theory establishes the market portfolio as an<br />
important baseline methodology. The assumption that capweighted<br />
indexes measure the market portfolio has led to<br />
their being considered the best proxies for measuring the<br />
Figure 2<br />
Sector (as Trading of 1/1/2010)<br />
Symbol<br />
Russell 1000<br />
Cap Weighted<br />
Russell 3-Month 1000 Average Constituent<br />
Daily Equal Volume Weight<br />
Russell 1000<br />
Sector Equal Weight<br />
Consumer Discretionary 12.0% 16.9% 11.1%<br />
Consumer Staples 9.2% 5.6% 11.1%<br />
Energy 11.4% 7.9% 11.1%<br />
Financial Services 15.4% 19.7% 11.1%<br />
Health Care 12.5% 10.0% 11.1%<br />
Materials & Processing 4.3% 7.4% 11.1%<br />
Producer Durables 10.6% 13.1% 11.1%<br />
Source: Russell Investments<br />
Comparison Of Sector Weights, As of 1/1/2010<br />
Technology 17.9% 11.8% 11.1%<br />
Utilities 6.7% 7.6% 11.1%<br />
www.journalofindexes.<strong>com</strong> January / February 2011<br />
21


