

Download complete issue - IndexUniverse.com
Download complete issue - IndexUniverse.com
Download complete issue - IndexUniverse.com

Create successful ePaper yourself
Turn your PDF publications into a flip-book with our unique Google optimized e-Paper software.
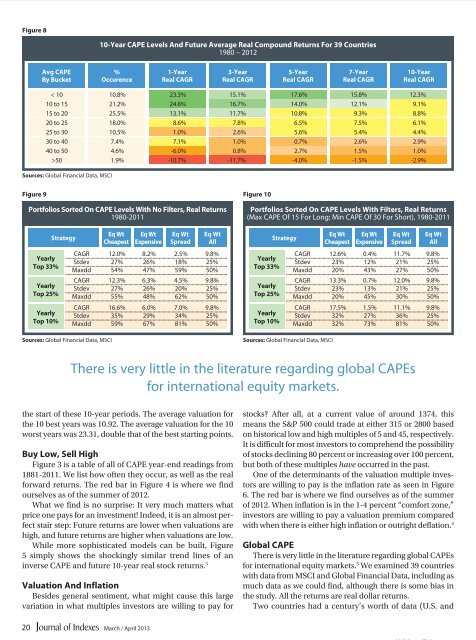
Figure 8<br />
10-Year CAPE Levels And Future Average Real Compound Returns For 39 Countries<br />
1980 – 2012<br />
Avg CAPE<br />
By Bucket<br />
%<br />
Occurence<br />
1-Year<br />
Real CAGR<br />
3-Year<br />
Real CAGR<br />
5-Year<br />
Real CAGR<br />
7-Year<br />
Real CAGR<br />
10-Year<br />
Real CAGR<br />
< 10 10.8% 23.3% 15.1% 17.6% 15.8% 12.3%<br />
10 to 15 21.2% 24.8% 16.7% 14.0% 12.1% 9.1%<br />
15 to 20 25.5% 13.1% 11.7% 10.8% 9.3% 8.8%<br />
20 to 25 18.0% 8.6% 7.8% 6.5% 7.5% 6.1%<br />
25 to 30 10.5% 1.0% 2.6% 5.6% 5.4% 4.4%<br />
30 to 40 7.4% 7.1% 1.0% 0.7% 2.6% 2.9%<br />
40 to 50 4.6% -6.0% 0.8% 2.7% 1.5% 1.0%<br />
>50 1.9% -10.7% -11.7% -4.0% -1.5% -2.9%<br />
Sources: Global Financial Data, MSCI<br />
Figure 9<br />
Portfolios Sorted On CAPE Levels With No Filters, Real Returns<br />
1980-2011<br />
Yearly<br />
Top 33%<br />
Yearly<br />
Top 25%<br />
Yearly<br />
Top 10%<br />
Strategy<br />
Sources: Global Financial Data, MSCI<br />
Eq Wt<br />
Cheapest<br />
Eq Wt<br />
Expensive<br />
Eq Wt<br />
Spread<br />
Eq Wt<br />
All<br />
CAGR 12.0% 8.2% 2.5% 9.8%<br />
Stdev 27% 26% 18% 25%<br />
Maxdd 54% 47% 59% 50%<br />
CAGR 12.3% 6.3% 4.5% 9.8%<br />
Stdev 27% 26% 20% 25%<br />
Maxdd 55% 48% 62% 50%<br />
CAGR 16.6% 6.0% 7.0% 9.8%<br />
Stdev 35% 29% 34% 25%<br />
Maxdd 59% 67% 81% 50%<br />
Figure 10<br />
Portfolios Sorted On CAPE Levels With Filters, Real Returns<br />
(Max CAPE Of 15 For Long; Min CAPE Of 30 For Short), 1980-2011<br />
Yearly<br />
Top 33%<br />
Yearly<br />
Top 25%<br />
Yearly<br />
Top 10%<br />
Strategy<br />
Sources: Global Financial Data, MSCI<br />
Eq Wt<br />
Cheapest<br />
Eq Wt<br />
Expensive<br />
Eq Wt<br />
Spread<br />
Eq Wt<br />
All<br />
CAGR 12.6% 0.4% 11.7% 9.8%<br />
Stdev 23% 12% 21% 25%<br />
Maxdd 20% 43% 27% 50%<br />
CAGR 13.3% 0.7% 12.0% 9.8%<br />
Stdev 23% 13% 21% 25%<br />
Maxdd 20% 45% 30% 50%<br />
CAGR 17.5% 1.5% 11.1% 9.8%<br />
Stdev 32% 27% 36% 25%<br />
Maxdd 32% 73% 81% 50%<br />
There is very little in the literature regarding global CAPEs<br />
for international equity markets.<br />
the start of these 10-year periods. The average valuation for<br />
the 10 best years was 10.92. The average valuation for the 10<br />
worst years was 23.31, double that of the best starting points.<br />
Buy Low, Sell High<br />
Figure 3 is a table of all of CAPE year-end readings from<br />
1881-2011. We list how often they occur, as well as the real<br />
forward returns. The red bar in Figure 4 is where we find<br />
ourselves as of the summer of 2012.<br />
What we find is no surprise: It very much matters what<br />
price one pays for an investment! Indeed, it is an almost perfect<br />
stair step: Future returns are lower when valuations are<br />
high, and future returns are higher when valuations are low.<br />
While more sophisticated models can be built, Figure<br />
5 simply shows the shockingly similar trend lines of an<br />
inverse CAPE and future 10-year real stock returns. 3<br />
Valuation And Inflation<br />
Besides general sentiment, what might cause this large<br />
variation in what multiples investors are willing to pay for<br />
stocks? After all, at a current value of around 1374, this<br />
means the S&P 500 could trade at either 315 or 2800 based<br />
on historical low and high multiples of 5 and 45, respectively.<br />
It is difficult for most investors to <strong>com</strong>prehend the possibility<br />
of stocks declining 80 percent or increasing over 100 percent,<br />
but both of these multiples have occurred in the past.<br />
One of the determinants of the valuation multiple investors<br />
are willing to pay is the inflation rate as seen in Figure<br />
6. The red bar is where we find ourselves as of the summer<br />
of 2012. When inflation is in the 1-4 percent “<strong>com</strong>fort zone,”<br />
investors are willing to pay a valuation premium <strong>com</strong>pared<br />
with when there is either high inflation or outright deflation. 4<br />
Global CAPE<br />
There is very little in the literature regarding global CAPEs<br />
for international equity markets. 5 We examined 39 countries<br />
with data from MSCI and Global Financial Data, including as<br />
much data as we could find, although there is some bias in<br />
the study. All the returns are real dollar returns.<br />
Two countries had a century’s worth of data (U.S. and<br />
20 March / April 2013


