Book 4: Pinellas County Storm Tide Atlas - Tampa Bay Regional ...
Book 4: Pinellas County Storm Tide Atlas - Tampa Bay Regional ...
Book 4: Pinellas County Storm Tide Atlas - Tampa Bay Regional ...

You also want an ePaper? Increase the reach of your titles
YUMPU automatically turns print PDFs into web optimized ePapers that Google loves.
Volume 7-8 <strong>Tampa</strong> <strong>Bay</strong><br />
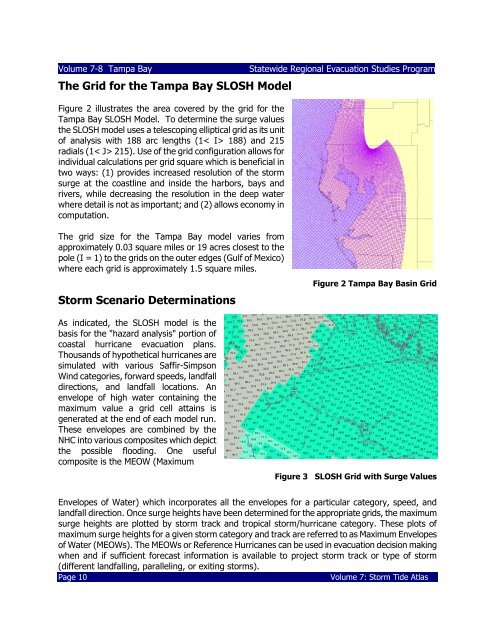
The Grid for the <strong>Tampa</strong> <strong>Bay</strong> SLOSH Model<br />
Figure 2 illustrates the area covered by the grid for the<br />
<strong>Tampa</strong> <strong>Bay</strong> SLOSH Model. To determine the surge values<br />
the SLOSH model uses a telescoping elliptical grid as its unit<br />
of analysis with 188 arc lengths (1< I> 188) and 215<br />
radials (1< J> 215). Use of the grid configuration allows for<br />
individual calculations per grid square which is beneficial in<br />
two ways: (1) provides increased resolution of the storm<br />
surge at the coastline and inside the harbors, bays and<br />
rivers, while decreasing the resolution in the deep water<br />
where detail is not as important; and (2) allows economy in<br />
computation.<br />
Statewide <strong>Regional</strong> Evacuation Studies Program<br />
The grid size for the <strong>Tampa</strong> <strong>Bay</strong> model varies from<br />
approximately 0.03 square miles or 19 acres closest to the<br />
pole (I = 1) to the grids on the outer edges (Gulf of Mexico)<br />
where each grid is approximately 1.5 square miles.<br />
<strong>Storm</strong> Scenario Determinations<br />
Figure 2 <strong>Tampa</strong> <strong>Bay</strong> Basin Grid<br />
As indicated, the SLOSH model is the<br />
basis for the "hazard analysis" portion of<br />
coastal hurricane evacuation plans.<br />
Thousands of hypothetical hurricanes are<br />
simulated with various Saffir-Simpson<br />
Wind categories, forward speeds, landfall<br />
directions, and landfall locations. An<br />
envelope of high water containing the<br />
maximum value a grid cell attains is<br />
generated at the end of each model run.<br />
These envelopes are combined by the<br />
NHC into various composites which depict<br />
the possible flooding. One useful<br />
composite is the MEOW (Maximum<br />
Figure 3 SLOSH Grid with Surge Values<br />
Envelopes of Water) which incorporates all the envelopes for a particular category, speed, and<br />
landfall direction. Once surge heights have been determined for the appropriate grids, the maximum<br />
surge heights are plotted by storm track and tropical storm/hurricane category. These plots of<br />
maximum surge heights for a given storm category and track are referred to as Maximum Envelopes<br />
of Water (MEOWs). The MEOWs or Reference Hurricanes can be used in evacuation decision making<br />
when and if sufficient forecast information is available to project storm track or type of storm<br />
(different landfalling, paralleling, or exiting storms).<br />
Page 10<br />
Volume 7: <strong>Storm</strong> <strong>Tide</strong> <strong>Atlas</strong>