Book 4: Pinellas County Storm Tide Atlas - Tampa Bay Regional ...
Book 4: Pinellas County Storm Tide Atlas - Tampa Bay Regional ...
Book 4: Pinellas County Storm Tide Atlas - Tampa Bay Regional ...

You also want an ePaper? Increase the reach of your titles
YUMPU automatically turns print PDFs into web optimized ePapers that Google loves.
Volume 7-8 <strong>Tampa</strong> <strong>Bay</strong><br />
Statewide <strong>Regional</strong> Evacuation Studies Program<br />
CREATION OF THE STORM TIDE ZONES<br />
The maps in this atlas depict SLOSH-modeled heights of storm tide and extent of flood inundation<br />
for hurricanes of five different intensities. As indicate above, the storm tide was modeled using the<br />
Maximum of Maximums (MOMs) representing the potential flooding from the five categories of storm<br />
intensity of the Saffir/Simpson Hurricane Wind Scale.<br />
Determining <strong>Storm</strong> tide Height and<br />
Flooding Depth<br />
SLOSH and SLOSH-related products reference storm<br />
tide heights relative to the model vertical datum,<br />
NAVD88. In order to determine the inundation depth<br />
of surge flooding at a particular location the ground<br />
elevation (relative to NAVD88) at that location must<br />
be subtracted from the potential surge height. 2<br />
Surge elevation, or water height, is the output of the<br />
SLOSH model. At each SLOSH grid point, the<br />
maximum surge height is computed at that point.<br />
Within the SLOSH model an average elevation is<br />
assumed within each grid square. Height of water<br />
above terrain was not calculated using the SLOSH<br />
average grid elevation because terrain height may<br />
vary significantly within a SLOSH grid square. For<br />
example, the altitude of a 1-mile grid square may be<br />
assigned a value of 1.8 meters (6 feet), but this value<br />
represents an average of land heights that may<br />
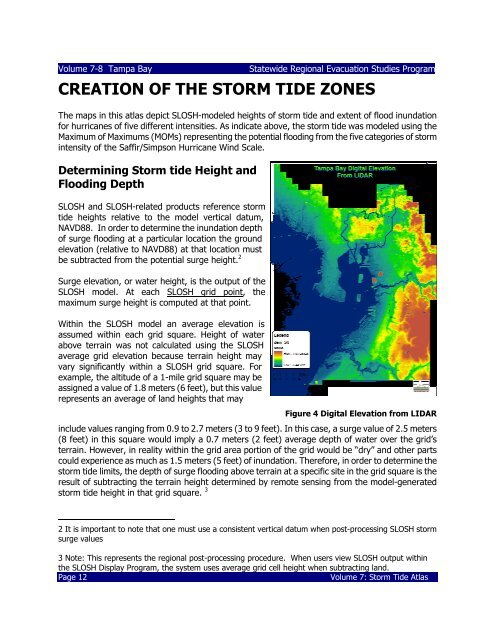
Figure 4 Digital Elevation from LIDAR<br />
include values ranging from 0.9 to 2.7 meters (3 to 9 feet). In this case, a surge value of 2.5 meters<br />
(8 feet) in this square would imply a 0.7 meters (2 feet) average depth of water over the grid’s<br />
terrain. However, in reality within the grid area portion of the grid would be “dry” and other parts<br />
could experience as much as 1.5 meters (5 feet) of inundation. Therefore, in order to determine the<br />
storm tide limits, the depth of surge flooding above terrain at a specific site in the grid square is the<br />
result of subtracting the terrain height determined by remote sensing from the model-generated<br />
storm tide height in that grid square. 3<br />
2 It is important to note that one must use a consistent vertical datum when post-processing SLOSH storm<br />
surge values<br />
3 Note: This represents the regional post-processing procedure. When users view SLOSH output within<br />
the SLOSH Display Program, the system uses average grid cell height when subtracting land.<br />
Page 12<br />
Volume 7: <strong>Storm</strong> <strong>Tide</strong> <strong>Atlas</strong>