2012 Half Year Results Media Presentation - Origin Energy
2012 Half Year Results Media Presentation - Origin Energy
2012 Half Year Results Media Presentation - Origin Energy

Create successful ePaper yourself
Turn your PDF publications into a flip-book with our unique Google optimized e-Paper software.
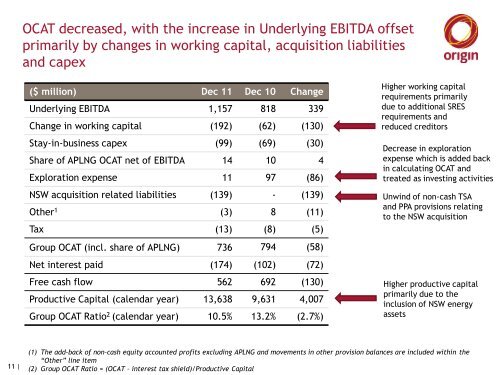
OCAT decreased, with the increase in Underlying EBITDA offset<br />
primarily by changes in working capital, acquisition liabilities<br />
and capex<br />
($ million) Dec 11 Dec 10 Change<br />
Underlying EBITDA 1,157 818 339<br />
Change in working capital (192) (62) (130)<br />
Stay-in-business capex (99) (69) (30)<br />
Share of APLNG OCAT net of EBITDA 14 10 4<br />
Exploration expense 11 97 (86)<br />
NSW acquisition related liabilities (139) - (139)<br />
Other 1 (3) 8 (11)<br />
Tax (13) (8) (5)<br />
Group OCAT (incl. share of APLNG) 736 794 (58)<br />
Net interest paid (174) (102) (72)<br />
Free cash flow 562 692 (130)<br />
Productive Capital (calendar year) 13,638 9,631 4,007<br />
Group OCAT Ratio 2 (calendar year) 10.5% 13.2% (2.7%)<br />
Higher working capital<br />
requirements primarily<br />
due to additional SRES<br />
requirements and<br />
reduced creditors<br />
Decrease in exploration<br />
expense which is added back<br />
in calculating OCAT and<br />
treated as investing activities<br />
Unwind of non-cash TSA<br />
and PPA provisions relating<br />
to the NSW acquisition<br />
Higher productive capital<br />
primarily due to the<br />
inclusion of NSW energy<br />
assets<br />
11 |<br />
(1) The add-back of non–cash equity accounted profits excluding APLNG and movements in other provision balances are included within the<br />
“Other” line item<br />
(2) Group OCAT Ratio = (OCAT – interest tax shield)/Productive Capital