2012 Half Year Results Media Presentation - Origin Energy
2012 Half Year Results Media Presentation - Origin Energy
2012 Half Year Results Media Presentation - Origin Energy

You also want an ePaper? Increase the reach of your titles
YUMPU automatically turns print PDFs into web optimized ePapers that Google loves.
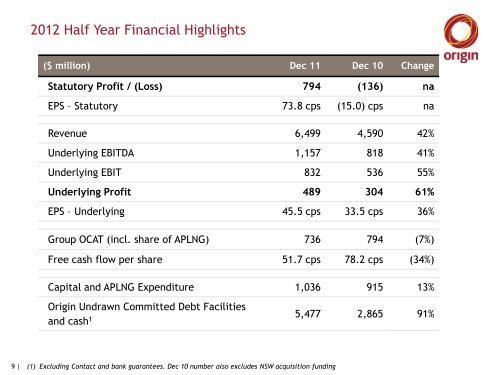
<strong>2012</strong> <strong>Half</strong> <strong>Year</strong> Financial Highlights<br />
($ million) Dec 11 Dec 10 Change<br />
Statutory Profit / (Loss) 794 (136) na<br />
EPS – Statutory 73.8 cps (15.0) cps na<br />
Revenue 6,499 4,590 42%<br />
Underlying EBITDA 1,157 818 41%<br />
Underlying EBIT 832 536 55%<br />
Underlying Profit 489 304 61%<br />
EPS – Underlying 45.5 cps 33.5 cps 36%<br />
Group OCAT (incl. share of APLNG) 736 794 (7%)<br />
Free cash flow per share 51.7 cps 78.2 cps (34%)<br />
Capital and APLNG Expenditure 1,036 915 13%<br />
<strong>Origin</strong> Undrawn Committed Debt Facilities<br />
and cash 1 5,477 2,865 91%<br />
9 | (1) Excluding Contact and bank guarantees. Dec 10 number also excludes NSW acquisition funding