2012 Half Year Results Media Presentation - Origin Energy
2012 Half Year Results Media Presentation - Origin Energy
2012 Half Year Results Media Presentation - Origin Energy

Create successful ePaper yourself
Turn your PDF publications into a flip-book with our unique Google optimized e-Paper software.
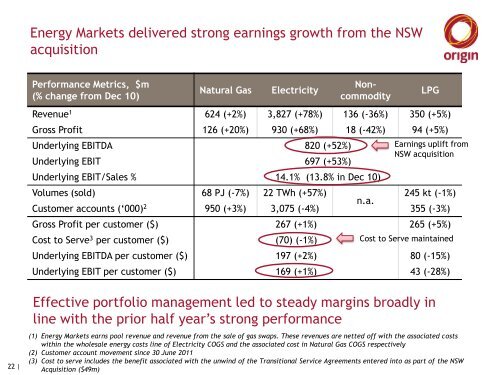
<strong>Energy</strong> Markets delivered strong earnings growth from the NSW<br />
acquisition<br />
Performance Metrics, $m<br />
(% change from Dec 10)<br />
Natural Gas<br />
Electricity<br />
Noncommodity<br />
Revenue 1 624 (+2%) 3,827 (+78%) 136 (-36%) 350 (+5%)<br />
Gross Profit 126 (+20%) 930 (+68%) 18 (-42%) 94 (+5%)<br />
Underlying EBITDA 820 (+52%)<br />
Underlying EBIT 697 (+53%)<br />
Underlying EBIT/Sales % 14.1% (13.8% in Dec 10)<br />
Volumes (sold) 68 PJ (-7%) 22 TWh (+57%)<br />
245 kt (-1%)<br />
n.a.<br />
Customer accounts („000) 2 950 (+3%) 3,075 (-4%) 355 (-3%)<br />
Gross Profit per customer ($) 267 (+1%) 265 (+5%)<br />
Cost to Serve 3 per customer ($) (70) (-1%)<br />
LPG<br />
Earnings uplift from<br />
NSW acquisition<br />
Cost to Serve maintained<br />
Underlying EBITDA per customer ($) 197 (+2%) 80 (-15%)<br />
Underlying EBIT per customer ($) 169 (+1%) 43 (-28%)<br />
22 |<br />
Effective portfolio management led to steady margins broadly in<br />
line with the prior half year‟s strong performance<br />
(1) <strong>Energy</strong> Markets earns pool revenue and revenue from the sale of gas swaps. These revenues are netted off with the associated costs<br />
within the wholesale energy costs line of Electricity COGS and the associated cost in Natural Gas COGS respectively<br />
(2) Customer account movement since 30 June 2011<br />
(3) Cost to serve includes the benefit associated with the unwind of the Transitional Service Agreements entered into as part of the NSW<br />
Acquisition ($49m)