Annual Report 2008-09 - Legal Services Commissioner
Annual Report 2008-09 - Legal Services Commissioner
Annual Report 2008-09 - Legal Services Commissioner

You also want an ePaper? Increase the reach of your titles
YUMPU automatically turns print PDFs into web optimized ePapers that Google loves.
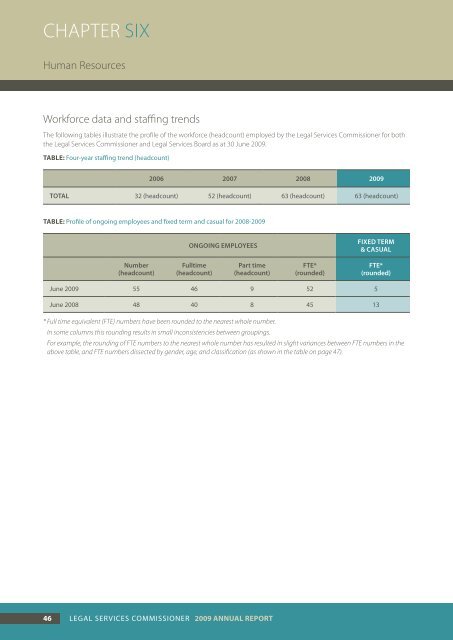
Chapter SIX<br />
Human Resources<br />
Workforce data and staffing trends<br />
The following tables illustrate the profile of the workforce (headcount) employed by the <strong>Legal</strong> <strong>Services</strong> <strong>Commissioner</strong> for both<br />
the <strong>Legal</strong> <strong>Services</strong> <strong>Commissioner</strong> and <strong>Legal</strong> <strong>Services</strong> Board as at 30 June 20<strong>09</strong>.<br />
Table: Four-year staffing trend (headcount)<br />
2006 2007 <strong>2008</strong> 20<strong>09</strong><br />
Total 32 (headcount) 52 (headcount) 63 (headcount) 63 (headcount)<br />
Table: Profile of ongoing employees and fixed term and casual for <strong>2008</strong>-20<strong>09</strong><br />
Ongoing Employees<br />
Fixed term<br />
& casual<br />
Number<br />
(headcount)<br />
Fulltime<br />
(headcount)<br />
Part time<br />
(headcount)<br />
FTE*<br />
(rounded)<br />
FTE*<br />
(rounded)<br />
June 20<strong>09</strong> 55 46 9 52 5<br />
June <strong>2008</strong> 48 40 8 45 13<br />
* Full time equivalent (FTE) numbers have been rounded to the nearest whole number.<br />
In some columns this rounding results in small inconsistencies between groupings.<br />
For example, the rounding of FTE numbers to the nearest whole number has resulted in slight variances between FTE numbers in the<br />
above table, and FTE numbers dissected by gender, age, and classification (as shown in the table on page 47).<br />
46 <strong>Legal</strong> <strong>Services</strong> COMMISSIONER 20<strong>09</strong> <strong>Annual</strong> <strong>Report</strong>