

soil - Lublin
soil - Lublin
soil - Lublin

You also want an ePaper? Increase the reach of your titles
YUMPU automatically turns print PDFs into web optimized ePapers that Google loves.
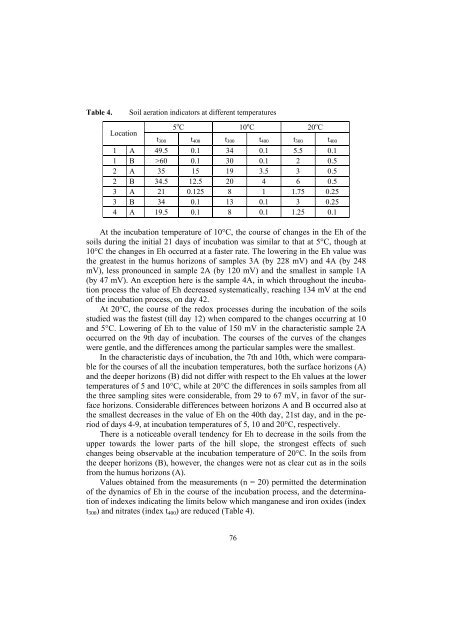
Table 4.<br />
Soil aeration indicators at different temperatures<br />
Location<br />
5 o C 10 o C 20 o C<br />
t 300 t 400 t 300 t 400 t 300 t 400<br />
1 A 49.5 0.1 34 0.1 5.5 0.1<br />
1 B >60 0.1 30 0.1 2 0.5<br />
2 A 35 15 19 3.5 3 0.5<br />
2 B 34.5 12.5 20 4 6 0.5<br />
3 A 21 0.125 8 1 1.75 0.25<br />
3 B 34 0.1 13 0.1 3 0.25<br />
4 A 19.5 0.1 8 0.1 1.25 0.1<br />
At the incubation temperature of 10°C, the course of changes in the Eh of the<br />
<strong>soil</strong>s during the initial 21 days of incubation was similar to that at 5°C, though at<br />
10°C the changes in Eh occurred at a faster rate. The lowering in the Eh value was<br />
the greatest in the humus horizons of samples 3A (by 228 mV) and 4A (by 248<br />
mV), less pronounced in sample 2A (by 120 mV) and the smallest in sample 1A<br />
(by 47 mV). An exception here is the sample 4A, in which throughout the incubation<br />
process the value of Eh decreased systematically, reaching 134 mV at the end<br />
of the incubation process, on day 42.<br />
At 20°C, the course of the redox processes during the incubation of the <strong>soil</strong>s<br />
studied was the fastest (till day 12) when compared to the changes occurring at 10<br />
and 5°C. Lowering of Eh to the value of 150 mV in the characteristic sample 2A<br />
occurred on the 9th day of incubation. The courses of the curves of the changes<br />
were gentle, and the differences among the particular samples were the smallest.<br />
In the characteristic days of incubation, the 7th and 10th, which were comparable<br />
for the courses of all the incubation temperatures, both the surface horizons (A)<br />
and the deeper horizons (B) did not differ with respect to the Eh values at the lower<br />
temperatures of 5 and 10°C, while at 20°C the differences in <strong>soil</strong>s samples from all<br />
the three sampling sites were considerable, from 29 to 67 mV, in favor of the surface<br />
horizons. Considerable differences between horizons A and B occurred also at<br />
the smallest decreases in the value of Eh on the 40th day, 21st day, and in the period<br />
of days 4-9, at incubation temperatures of 5, 10 and 20°C, respectively.<br />
There is a noticeable overall tendency for Eh to decrease in the <strong>soil</strong>s from the<br />
upper towards the lower parts of the hill slope, the strongest effects of such<br />
changes being observable at the incubation temperature of 20°C. In the <strong>soil</strong>s from<br />
the deeper horizons (B), however, the changes were not as clear cut as in the <strong>soil</strong>s<br />
from the humus horizons (A).<br />
Values obtained from the measurements (n = 20) permitted the determination<br />
of the dynamics of Eh in the course of the incubation process, and the determination<br />
of indexes indicating the limits below which manganese and iron oxides (index<br />
t 300 ) and nitrates (index t 400 ) are reduced (Table 4).<br />
76


