a socio-economic baseline assessment of the mnazi bay - IUCN
a socio-economic baseline assessment of the mnazi bay - IUCN
a socio-economic baseline assessment of the mnazi bay - IUCN

Create successful ePaper yourself
Turn your PDF publications into a flip-book with our unique Google optimized e-Paper software.
structure), and <strong>the</strong>ir representation <strong>of</strong> locations in <strong>the</strong> Marine Park (<strong>the</strong> three areas identifies as<br />
seafront, mangrove and inland/river).<br />
Questionnaires were administered in Swahili. A team <strong>of</strong> interviewers was trained in each <strong>of</strong> <strong>the</strong> villages<br />
surveyed. The questionnaire took no more than 15 to 20 minutes to be administered and a total <strong>of</strong> 643<br />
households were interviewed (see Table 1).<br />
1.4.5 Sampling strategy<br />
The “household” was chosen as <strong>the</strong> unit <strong>of</strong> study. Indeed, <strong>the</strong> household is considered as being <strong>the</strong> unit<br />
at which resources are pooled and decisions taken about consumption, production and investment<br />
(Corbett, 1988).<br />
Non-random as well as random sampling methods were used. For <strong>the</strong> Occupational structure, purposive<br />
sampling was chosen (Bernard, 1995). Informants (men and women who knew <strong>the</strong> community well)<br />
were suggested by <strong>the</strong> Village Liaison Committee according to research needs.<br />
The occupational structure provided a comprehensive list <strong>of</strong> households (head <strong>of</strong> household name)<br />
which was <strong>the</strong>n used as a sampling frame for <strong>the</strong> focus groups and <strong>the</strong> household survey. Participants<br />
to <strong>the</strong> focus groups were selected randomly according to <strong>the</strong>ir activity. Simple random sampling was<br />
used to select <strong>the</strong> households to be surveyed.<br />
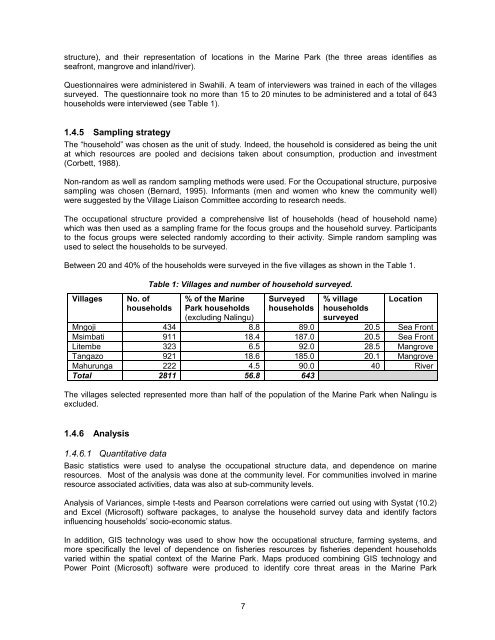
Between 20 and 40% <strong>of</strong> <strong>the</strong> households were surveyed in <strong>the</strong> five villages as shown in <strong>the</strong> Table 1.<br />
Villages<br />
Table 1: Villages and number <strong>of</strong> household surveyed.<br />
No. <strong>of</strong><br />
households<br />
% <strong>of</strong> <strong>the</strong> Marine<br />
Park households<br />
(excluding Nalingu)<br />
Surveyed<br />
households<br />
% village<br />
households<br />
surveyed<br />
Location<br />
Mngoji 434 8.8 89.0 20.5 Sea Front<br />
Msimbati 911 18.4 187.0 20.5 Sea Front<br />
Litembe 323 6.5 92.0 28.5 Mangrove<br />
Tangazo 921 18.6 185.0 20.1 Mangrove<br />
Mahurunga 222 4.5 90.0 40 River<br />
Total 2811 56.8 643<br />
The villages selected represented more than half <strong>of</strong> <strong>the</strong> population <strong>of</strong> <strong>the</strong> Marine Park when Nalingu is<br />
excluded.<br />
1.4.6 Analysis<br />
1.4.6.1 Quantitative data<br />
Basic statistics were used to analyse <strong>the</strong> occupational structure data, and dependence on marine<br />
resources. Most <strong>of</strong> <strong>the</strong> analysis was done at <strong>the</strong> community level. For communities involved in marine<br />
resource associated activities, data was also at sub-community levels.<br />
Analysis <strong>of</strong> Variances, simple t-tests and Pearson correlations were carried out using with Systat (10.2)<br />
and Excel (Micros<strong>of</strong>t) s<strong>of</strong>tware packages, to analyse <strong>the</strong> household survey data and identify factors<br />
influencing households’ <strong>socio</strong>-<strong>economic</strong> status.<br />
In addition, GIS technology was used to show how <strong>the</strong> occupational structure, farming systems, and<br />
more specifically <strong>the</strong> level <strong>of</strong> dependence on fisheries resources by fisheries dependent households<br />
varied within <strong>the</strong> spatial context <strong>of</strong> <strong>the</strong> Marine Park. Maps produced combining GIS technology and<br />
Power Point (Micros<strong>of</strong>t) s<strong>of</strong>tware were produced to identify core threat areas in <strong>the</strong> Marine Park<br />
7