a socio-economic baseline assessment of the mnazi bay - IUCN
a socio-economic baseline assessment of the mnazi bay - IUCN
a socio-economic baseline assessment of the mnazi bay - IUCN
Create successful ePaper yourself
Turn your PDF publications into a flip-book with our unique Google optimized e-Paper software.
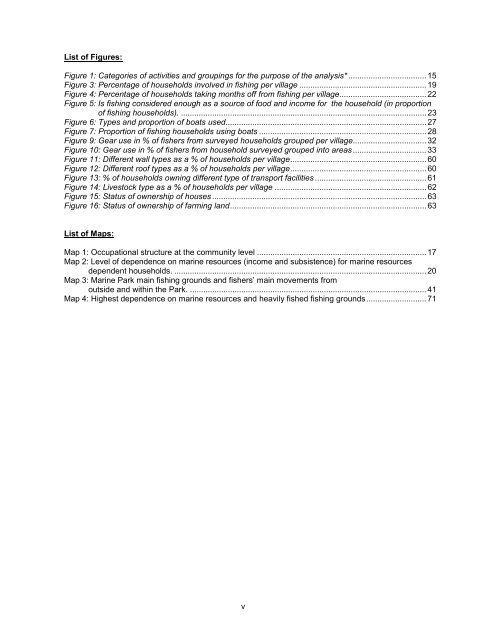
List <strong>of</strong> Figures:<br />
Figure 1: Categories <strong>of</strong> activities and groupings for <strong>the</strong> purpose <strong>of</strong> <strong>the</strong> analysis* ................................... 15<br />
Figure 3: Percentage <strong>of</strong> households involved in fishing per village ......................................................... 19<br />
Figure 4: Percentage <strong>of</strong> households taking months <strong>of</strong>f from fishing per village....................................... 22<br />
Figure 5: Is fishing considered enough as a source <strong>of</strong> food and income for <strong>the</strong> household (in proportion<br />
<strong>of</strong> fishing households). .............................................................................................................. 23<br />
Figure 6: Types and proportion <strong>of</strong> boats used.......................................................................................... 27<br />
Figure 7: Proportion <strong>of</strong> fishing households using boats ........................................................................... 28<br />
Figure 9: Gear use in % <strong>of</strong> fishers from surveyed households grouped per village................................. 32<br />
Figure 10: Gear use in % <strong>of</strong> fishers from household surveyed grouped into areas................................. 33<br />
Figure 11: Different wall types as a % <strong>of</strong> households per village............................................................. 60<br />
Figure 12: Different ro<strong>of</strong> types as a % <strong>of</strong> households per village............................................................. 60<br />
Figure 13: % <strong>of</strong> households owning different type <strong>of</strong> transport facilities .................................................. 61<br />
Figure 14: Livestock type as a % <strong>of</strong> households per village .................................................................... 62<br />
Figure 15: Status <strong>of</strong> ownership <strong>of</strong> houses ................................................................................................ 63<br />
Figure 16: Status <strong>of</strong> ownership <strong>of</strong> farming land........................................................................................ 63<br />
List <strong>of</strong> Maps:<br />
Map 1: Occupational structure at <strong>the</strong> community level ............................................................................ 17<br />
Map 2: Level <strong>of</strong> dependence on marine resources (income and subsistence) for marine resources<br />
dependent households. ................................................................................................................. 20<br />
Map 3: Marine Park main fishing grounds and fishers’ main movements from<br />
outside and within <strong>the</strong> Park. .......................................................................................................... 41<br />
Map 4: Highest dependence on marine resources and heavily fished fishing grounds........................... 71<br />
v


