a socio-economic baseline assessment of the mnazi bay - IUCN
a socio-economic baseline assessment of the mnazi bay - IUCN
a socio-economic baseline assessment of the mnazi bay - IUCN

You also want an ePaper? Increase the reach of your titles
YUMPU automatically turns print PDFs into web optimized ePapers that Google loves.
Factors<br />
Number <strong>of</strong><br />
activities<br />
Sole dependence<br />
on Marine<br />
resources<br />
Area (excluding<br />
Mahurunga)<br />
Table 29: Significant Pearson correlation<br />
All households Marine dep. Fishing dep.<br />
Households households<br />
N r p N t p N r p<br />
640 0.104 0.02 170 0.172 0.03<br />
220 4.7 0.00 158 2.7 0.02<br />
169 2.5 0.02<br />
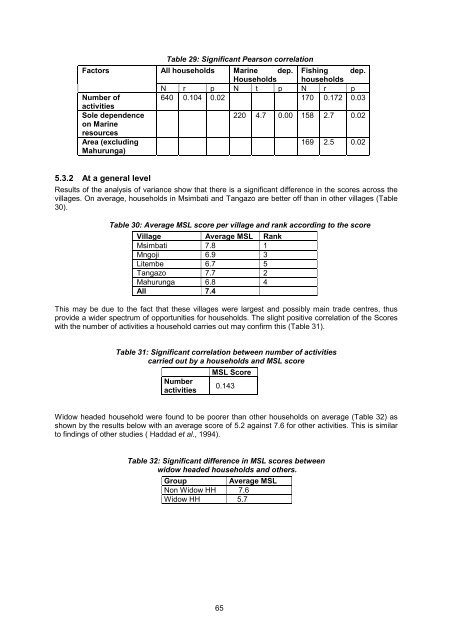
5.3.2 At a general level<br />
Results <strong>of</strong> <strong>the</strong> analysis <strong>of</strong> variance show that <strong>the</strong>re is a significant difference in <strong>the</strong> scores across <strong>the</strong><br />
villages. On average, households in Msimbati and Tangazo are better <strong>of</strong>f than in o<strong>the</strong>r villages (Table<br />
30).<br />
Table 30: Average MSL score per village and rank according to <strong>the</strong> score<br />
Village Average MSL Rank<br />
Msimbati 7.8 1<br />
Mngoji 6.9 3<br />
Litembe 6.7 5<br />
Tangazo 7.7 2<br />
Mahurunga 6.8 4<br />
All 7.4<br />
This may be due to <strong>the</strong> fact that <strong>the</strong>se villages were largest and possibly main trade centres, thus<br />
provide a wider spectrum <strong>of</strong> opportunities for households. The slight positive correlation <strong>of</strong> <strong>the</strong> Scores<br />
with <strong>the</strong> number <strong>of</strong> activities a household carries out may confirm this (Table 31).<br />
Table 31: Significant correlation between number <strong>of</strong> activities<br />
carried out by a households and MSL score<br />
Number<br />
activities<br />
MSL Score<br />
0.143<br />
Widow headed household were found to be poorer than o<strong>the</strong>r households on average (Table 32) as<br />
shown by <strong>the</strong> results below with an average score <strong>of</strong> 5.2 against 7.6 for o<strong>the</strong>r activities. This is similar<br />
to findings <strong>of</strong> o<strong>the</strong>r studies ( Haddad et al., 1994).<br />
Table 32: Significant difference in MSL scores between<br />
widow headed households and o<strong>the</strong>rs.<br />
Group<br />
Average MSL<br />
Non Widow HH 7.6<br />
Widow HH 5.7<br />
65