a socio-economic baseline assessment of the mnazi bay - IUCN
a socio-economic baseline assessment of the mnazi bay - IUCN
a socio-economic baseline assessment of the mnazi bay - IUCN

You also want an ePaper? Increase the reach of your titles
YUMPU automatically turns print PDFs into web optimized ePapers that Google loves.
%<br />
100<br />
90<br />
80<br />
70<br />
60<br />
50<br />
40<br />
30<br />
20<br />
10<br />
0<br />
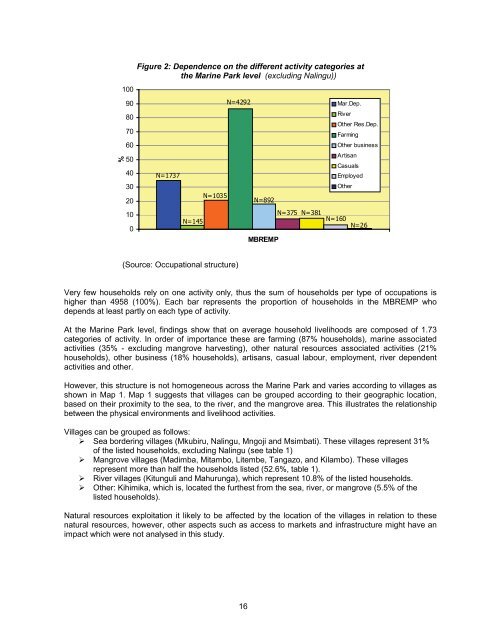
Figure 2: Dependence on <strong>the</strong> different activity categories at<br />
<strong>the</strong> Marine Park level (excluding Nalingu))<br />
N=1737<br />
N=145<br />
N=1035<br />
N=4292<br />
MBREMP 1<br />
Mar.Dep.<br />
River<br />
O<strong>the</strong>r Res.Dep.<br />
Farming<br />
O<strong>the</strong>r business<br />
Artisan<br />
Casuals<br />
Employed<br />
O<strong>the</strong>r<br />
N=892<br />
N=375 N=381<br />
N=160<br />
N=26<br />
(Source: Occupational structure)<br />
Very few households rely on one activity only, thus <strong>the</strong> sum <strong>of</strong> households per type <strong>of</strong> occupations is<br />
higher than 4958 (100%). Each bar represents <strong>the</strong> proportion <strong>of</strong> households in <strong>the</strong> MBREMP who<br />
depends at least partly on each type <strong>of</strong> activity.<br />
At <strong>the</strong> Marine Park level, findings show that on average household livelihoods are composed <strong>of</strong> 1.73<br />
categories <strong>of</strong> activity. In order <strong>of</strong> importance <strong>the</strong>se are farming (87% households), marine associated<br />
activities (35% - excluding mangrove harvesting), o<strong>the</strong>r natural resources associated activities (21%<br />
households), o<strong>the</strong>r business (18% households), artisans, casual labour, employment, river dependent<br />
activities and o<strong>the</strong>r.<br />
However, this structure is not homogeneous across <strong>the</strong> Marine Park and varies according to villages as<br />
shown in Map 1. Map 1 suggests that villages can be grouped according to <strong>the</strong>ir geographic location,<br />
based on <strong>the</strong>ir proximity to <strong>the</strong> sea, to <strong>the</strong> river, and <strong>the</strong> mangrove area. This illustrates <strong>the</strong> relationship<br />
between <strong>the</strong> physical environments and livelihood activities.<br />
Villages can be grouped as follows:<br />
Sea bordering villages (Mkubiru, Nalingu, Mngoji and Msimbati). These villages represent 31%<br />
<strong>of</strong> <strong>the</strong> listed households, excluding Nalingu (see table 1)<br />
Mangrove villages (Madimba, Mitambo, Litembe, Tangazo, and Kilambo). These villages<br />
represent more than half <strong>the</strong> households listed (52.6%, table 1).<br />
River villages (Kitunguli and Mahurunga), which represent 10.8% <strong>of</strong> <strong>the</strong> listed households.<br />
O<strong>the</strong>r: Kihimika, which is, located <strong>the</strong> fur<strong>the</strong>st from <strong>the</strong> sea, river, or mangrove (5.5% <strong>of</strong> <strong>the</strong><br />
listed households).<br />
Natural resources exploitation it likely to be affected by <strong>the</strong> location <strong>of</strong> <strong>the</strong> villages in relation to <strong>the</strong>se<br />
natural resources, however, o<strong>the</strong>r aspects such as access to markets and infrastructure might have an<br />
impact which were not analysed in this study.<br />
16