a socio-economic baseline assessment of the mnazi bay - IUCN
a socio-economic baseline assessment of the mnazi bay - IUCN
a socio-economic baseline assessment of the mnazi bay - IUCN

Create successful ePaper yourself
Turn your PDF publications into a flip-book with our unique Google optimized e-Paper software.
3 GENERAL OCCUPATIONAL STRUCTURE AND DEPENDENCE ON MARINE<br />
AND OTHER RESOURCES IN THE MARINE PARK<br />
Dependence on marine resources (proportion <strong>of</strong> households involved in marine resources related<br />
livelihood activity, importance <strong>of</strong> marine related activities in <strong>the</strong> household’s livelihood system) is an<br />
indicator <strong>of</strong> potential threats to marine resources. The more households are dependent on marine<br />
resources for <strong>the</strong>ir livelihoods, <strong>the</strong> more <strong>the</strong>y are likely to be defensive about <strong>the</strong>ir activity, and reducing<br />
pressure on marine resources by zoning activities or banning certain gears without acceptable<br />
alternatives proposed may be difficult. This section concentrates on evaluating how much Marine Park<br />
communities depend on marine resources.<br />
Dependence on o<strong>the</strong>r natural resources (wood, wild plants, mangroves…) was also investigated at a<br />
broader level as <strong>the</strong>se may by essential for <strong>the</strong> integrity <strong>of</strong> <strong>the</strong> marine ecosystem to be preserved (e.g.<br />
mangrove forests, terrestrial coastal forests). Fur<strong>the</strong>rmore, <strong>the</strong>se o<strong>the</strong>r resources are part <strong>of</strong> <strong>the</strong><br />
attraction <strong>of</strong> <strong>the</strong> Marine Park.<br />
3.1 Demographics/Marine Park stakeholders<br />
The occupational structure provided information on a total <strong>of</strong> 4958 households from 11 villages. Due to<br />
<strong>the</strong> difficulty <strong>of</strong> accessing Nalingu, <strong>the</strong> village was not included in this research. Although some<br />
households may have been omitted, it is believed that most households were listed. This list will<br />
constitute a good sampling frame for fur<strong>the</strong>r research.<br />
When investigating <strong>the</strong> occupational structure, information on <strong>the</strong> number <strong>of</strong> household members, <strong>the</strong><br />
number <strong>of</strong> active people in <strong>the</strong> households was also required. Similarly <strong>the</strong> household size was<br />
investigated in <strong>the</strong> household survey in selected villages (refer to part 1.4.4). Table 4 summarises this<br />
information.<br />
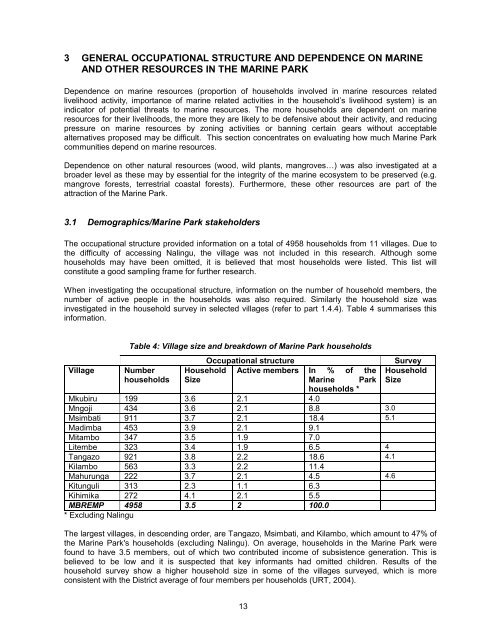
Table 4: Village size and breakdown <strong>of</strong> Marine Park households<br />
Occupational structure<br />
Survey<br />
Village Number Household Active members In % <strong>of</strong> <strong>the</strong> Household<br />
households Size<br />
Marine Park Size<br />
households *<br />
Mkubiru 199 3.6 2.1 4.0<br />
Mngoji 434 3.6 2.1 8.8 3.0<br />
Msimbati 911 3.7 2.1 18.4 5.1<br />
Madimba 453 3.9 2.1 9.1<br />
Mitambo 347 3.5 1.9 7.0<br />
Litembe 323 3.4 1.9 6.5 4<br />
Tangazo 921 3.8 2.2 18.6 4.1<br />
Kilambo 563 3.3 2.2 11.4<br />
Mahurunga 222 3.7 2.1 4.5 4.6<br />
Kitunguli 313 2.3 1.1 6.3<br />
Kihimika 272 4.1 2.1 5.5<br />
MBREMP 4958 3.5 2 100.0<br />
* Excluding Nalingu<br />
The largest villages, in descending order, are Tangazo, Msimbati, and Kilambo, which amount to 47% <strong>of</strong><br />
<strong>the</strong> Marine Park's households (excluding Nalingu). On average, households in <strong>the</strong> Marine Park were<br />
found to have 3.5 members, out <strong>of</strong> which two contributed income <strong>of</strong> subsistence generation. This is<br />
believed to be low and it is suspected that key informants had omitted children. Results <strong>of</strong> <strong>the</strong><br />
household survey show a higher household size in some <strong>of</strong> <strong>the</strong> villages surveyed, which is more<br />
consistent with <strong>the</strong> District average <strong>of</strong> four members per households (URT, 2004).<br />
13