Quarterly Bulletin Q3 2013
Quarterly Bulletin Q3 2013
Quarterly Bulletin Q3 2013

You also want an ePaper? Increase the reach of your titles
YUMPU automatically turns print PDFs into web optimized ePapers that Google loves.
24<br />
The Domestic Economy<br />
<strong>Quarterly</strong> <strong>Bulletin</strong> 03 / July 13<br />
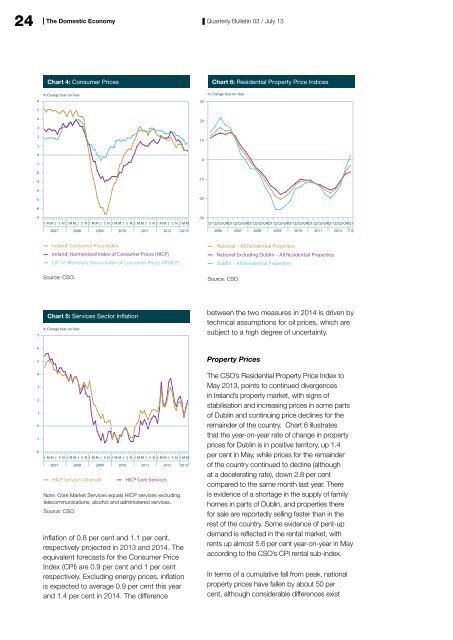
Chart 4: Consumer Prices<br />
Chart 6: Residential Property Price Indices<br />
% Change Year-on-Year<br />
% Change Year-on-Year<br />
6<br />
30<br />
5<br />
4<br />
20<br />
3<br />
2<br />
1<br />
10<br />
0<br />
-1<br />
0<br />
-2<br />
-3<br />
-10<br />
-4<br />
-5<br />
-20<br />
-6<br />
-7<br />
JMMJ SNJMMJ SNJMMJ SNJMMJ SNJMMJ SNJMM J S N J MM<br />
-30<br />
Q1 Q2 <strong>Q3</strong>Q4Q1<br />
Q2 <strong>Q3</strong>Q4Q1<br />
Q2 <strong>Q3</strong>Q4Q1<br />
Q2 <strong>Q3</strong>Q4Q1<br />
Q2 <strong>Q3</strong>Q4Q1<br />
Q2 <strong>Q3</strong>Q4Q1<br />
Q2 <strong>Q3</strong>Q4<br />
Q1<br />
2007 2008 2009 2010 2011 2012 <strong>2013</strong><br />
2006 2007 2008 2009 2010 2011 2012 ‘13<br />
Ireland: Consumer Price Index<br />
Ireland: Harmonised Index of Consumer Prices (HICP)<br />
EA-17: Monetary Union Index of Consumer Prices (MUICP)<br />
National – All Residential Properties<br />
National Excluding Dublin – All Residential Properties<br />
Dublin – All Residential Properties<br />
Source: CSO.<br />
Source: CSO.<br />
7<br />
Chart 5: Services Sector Inflation<br />
% Change Year-on-Year<br />
between the two measures in 2014 is driven by<br />
technical assumptions for oil prices, which are<br />
subject to a high degree of uncertainty.<br />
6<br />
5<br />
Property Prices<br />
4<br />
3<br />
2<br />
1<br />
0<br />
-1<br />
-2<br />
JMMJ SNJMMJ SNJMMJ SNJMMJ SNJMMJ SNJMM J S N J MM<br />
2007 2008 2009 2010 2011 2012 <strong>2013</strong><br />
HICP Services (Overall)<br />
HICP Core Services<br />
Note: Core Market Services equals HICP services excluding<br />
telecommunications, alcohol and administered services.<br />
Source: CSO.<br />
inflation of 0.8 per cent and 1.1 per cent,<br />
respectively projected in <strong>2013</strong> and 2014. The<br />
equivalent forecasts for the Consumer Price<br />
Index (CPI) are 0.9 per cent and 1 per cent<br />
respectively. Excluding energy prices, inflation<br />
is expected to average 0.9 per cent this year<br />
and 1.4 per cent in 2014. The difference<br />
The CSO’s Residential Property Price Index to<br />
May <strong>2013</strong>, points to continued divergences<br />
in Ireland’s property market, with signs of<br />
stabilisation and increasing prices in some parts<br />
of Dublin and continuing price declines for the<br />
remainder of the country. Chart 6 illustrates<br />
that the year-on-year rate of change in property<br />
prices for Dublin is in positive territory, up 1.4<br />
per cent in May, while prices for the remainder<br />
of the country continued to decline (although<br />
at a decelerating rate), down 2.8 per cent<br />
compared to the same month last year. There<br />
is evidence of a shortage in the supply of family<br />
homes in parts of Dublin, and properties there<br />
for sale are reportedly selling faster than in the<br />
rest of the country. Some evidence of pent-up<br />
demand is reflected in the rental market, with<br />
rents up almost 5.6 per cent year-on-year in May<br />
according to the CSO’s CPI rental sub-index.<br />
In terms of a cumulative fall from peak, national<br />
property prices have fallen by about 50 per<br />
cent, although considerable differences exist