Quarterly Bulletin Q3 2013
Quarterly Bulletin Q3 2013
Quarterly Bulletin Q3 2013

You also want an ePaper? Increase the reach of your titles
YUMPU automatically turns print PDFs into web optimized ePapers that Google loves.
46<br />
Financing Developments<br />
<strong>Quarterly</strong> <strong>Bulletin</strong> 03 / July 13<br />
in the Irish Economy<br />
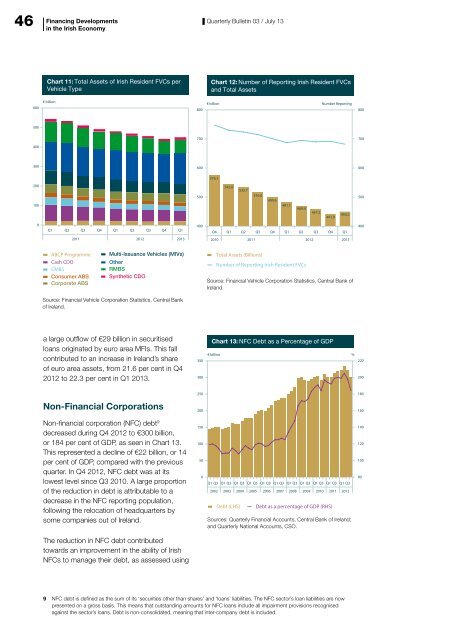
Chart 11: Total Assets of Irish Resident FVCs per<br />
Vehicle Type<br />
Chart 12: Number of Reporting Irish Resident FVCs<br />
and Total Assets<br />
600<br />
€ billion<br />
800<br />
€ billion Number Reporting<br />
800<br />
500<br />
700<br />
700<br />
400<br />
300<br />
600<br />
600<br />
576.1<br />
200<br />
100<br />
500<br />
543.8<br />
533.7<br />
516.6<br />
499.6<br />
481.1<br />
469.4<br />
457.2<br />
441.9<br />
450.2<br />
500<br />
0<br />
Q1 Q2 <strong>Q3</strong> Q4 Q1 Q2 <strong>Q3</strong> Q4 Q1<br />
400<br />
Q4<br />
Q1<br />
Q2<br />
<strong>Q3</strong><br />
Q4<br />
Q1<br />
Q2<br />
<strong>Q3</strong><br />
Q4<br />
Q1<br />
400<br />
2011<br />
2012 <strong>2013</strong><br />
2010 2011 2012<br />
<strong>2013</strong><br />
ABCP Programme<br />
Cash CDO<br />
CMBS<br />
Consumer ABS<br />
Corporate ABS<br />
Multi-Issuance Vehicles (MIVs)<br />
Other<br />
RMBS<br />
Synthetic CDO<br />
Total Assets (Billions)<br />
Number of Reporting Irish Resident FVCs<br />
Source: Financial Vehicle Corporation Statistics, Central Bank of<br />
Ireland.<br />
Source: Financial Vehicle Corporation Statistics, Central Bank<br />
of Ireland.<br />
a large outflow of €29 billion in securitised<br />
loans originated by euro area MFIs. This fall<br />
contributed to an increase in Ireland’s share<br />
of euro area assets, from 21.6 per cent in Q4<br />
2012 to 22.3 per cent in Q1 <strong>2013</strong>.<br />
350<br />
300<br />
Chart 13: NFC Debt as a Percentage of GDP<br />
€ billion %<br />
220<br />
200<br />
250<br />
180<br />
Non-Financial Corporations<br />
200<br />
160<br />
Non-financial corporation (NFC) debt 9<br />
decreased during Q4 2012 to €300 billion,<br />
or 184 per cent of GDP, as seen in Chart 13.<br />
This represented a decline of €22 billion, or 14<br />
per cent of GDP, compared with the previous<br />
quarter. In Q4 2012, NFC debt was at its<br />
lowest level since <strong>Q3</strong> 2010. A large proportion<br />
of the reduction in debt is attributable to a<br />
decrease in the NFC reporting population,<br />
following the relocation of headquarters by<br />
some companies out of Ireland.<br />
The reduction in NFC debt contributed<br />
towards an improvement in the ability of Irish<br />
NFCs to manage their debt, as assessed using<br />
150<br />
100<br />
50<br />
0<br />
Q1 <strong>Q3</strong><br />
Q1 <strong>Q3</strong><br />
Q1 <strong>Q3</strong><br />
Q1 <strong>Q3</strong><br />
Q1 <strong>Q3</strong><br />
Q1 <strong>Q3</strong><br />
Q1 <strong>Q3</strong><br />
Q1 <strong>Q3</strong><br />
Q1 <strong>Q3</strong><br />
Q1 <strong>Q3</strong><br />
Q1 <strong>Q3</strong><br />
2002 2003 2004 2005 2006 2007 2008 2009 2010 2011 2012<br />
Debt (LHS)<br />
Debt as a percentage of GDP (RHS)<br />
Sources: <strong>Quarterly</strong> Financial Accounts, Central Bank of Ireland;<br />
and <strong>Quarterly</strong> National Accounts, CSO.<br />
140<br />
120<br />
100<br />
80<br />
9 NFC debt is defined as the sum of its ‘securities other than shares’ and ‘loans’ liabilities. The NFC sector’s loan liabilities are now<br />
presented on a gross basis. This means that outstanding amounts for NFC loans include all impairment provisions recognised<br />
against the sector’s loans. Debt is non-consolidated, meaning that inter-company debt is included.