Quarterly Bulletin Q3 2013
Quarterly Bulletin Q3 2013
Quarterly Bulletin Q3 2013

You also want an ePaper? Increase the reach of your titles
YUMPU automatically turns print PDFs into web optimized ePapers that Google loves.
60<br />
Developments in the International<br />
<strong>Quarterly</strong> <strong>Bulletin</strong> 03 / July 13<br />
and Euro Area Economy<br />
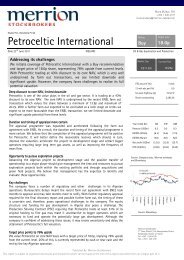
Box A: Correction of current account imbalances: how are the periphery economies progressing?<br />
By Bernard Kennedy and Mary Ryan<br />
15<br />
%<br />
Box A Chart 1: Current Account as<br />
a Percentage of GDP<br />
%<br />
Box A Chart 2: Change in Current<br />
Account Components as a percentage of<br />
GDP, 2007-2012<br />
30<br />
10<br />
25<br />
5<br />
20<br />
0<br />
15<br />
10<br />
-5<br />
5<br />
-10<br />
0<br />
IE GR ES PT IT<br />
-5<br />
-15<br />
-10<br />
-20<br />
-15<br />
Estonia<br />
Greece<br />
Cyprus<br />
Portugal<br />
Spain<br />
Malta<br />
Ireland<br />
Slovakia<br />
Slovenia<br />
Italy<br />
France<br />
Belgium<br />
2007 2012<br />
Austria<br />
Finland<br />
Netherlands<br />
Germany<br />
Luxembourg<br />
-20<br />
Net Exports of current transfers<br />
Net Exports of Income<br />
Imports<br />
Exports<br />
Source: Eurostat.<br />
Source: Eurostat, authors’ calculations.<br />
Note: Above the line indicates a positive contribution to<br />
current account balance, while the below the line denotes<br />
a negative impact on the current account balance.<br />
The improvement in export performance reflects a combination of competitiveness gains and<br />
partner country demand. As noted by Chen, Milesi-Ferratti and Tressel (2012) 5 , the periphery<br />
countries experienced real exchange rate appreciations in the years prior to the crisis. This<br />
loss of competitiveness originated to some extent in cost increases in the non-traded sectors,<br />
following a reallocation of resources in response to positive demand shocks (e.g. residential<br />
investment boom) with spill-over effects into the traded sector (see ESCB Working Group<br />
on Econometric Modelling, 2012 6 ). The years since the crisis have seen some reversal of the<br />
loss of competitiveness, although it should be noted that real exchange rates deflated by unit<br />
labour costs can exaggerate the improvement in competitiveness due to compositional effects.<br />
In particular, a shift in economic activity towards higher value added sectors can generate an<br />
improvement in competitiveness without any underlying sectoral improvements (see O’ Brien<br />
2011 7 ). Nonetheless, corrections have been consistent across the peripheral economies and<br />
pronounced in some cases 8 (see Chart 3). Ireland, in particular, witnessed a significant real<br />
exchange rate appreciation largely unwind, with a fall relative to peak of 26 per cent, with early<br />
and sustained adjustment evident. Adjustment in the southern periphery countries was more<br />
gradual at first and has been concentrated from mid-2011 onwards; Greece in particular has<br />
seen a 16 per cent fall in the real exchange rate since then.<br />
5 Chen, Milesi-Ferratti and Tressel. “External Imbalances in the Euro Area”, IMF Working Paper WP/12/236.<br />
6 A team of the Working Group on Econometric Modelling of the ESCB, 2012. “Competitive and external imbalances within<br />
the euro area”, ECB Occasional Paper No. 139, December 2012.<br />
7 O’Brien, Derry (2011) “The compositional Effects in Recent Trends in Irish Unit Labour Costs”, Box A, Domestic Economy<br />
Chapter, Central Bank <strong>Quarterly</strong> <strong>Bulletin</strong>, Q1 2011.<br />
8 It is also the case that there is adjustment in the real exchange rate relative to the HICP.