Quarterly Bulletin Q3 2013
Quarterly Bulletin Q3 2013
Quarterly Bulletin Q3 2013

Create successful ePaper yourself
Turn your PDF publications into a flip-book with our unique Google optimized e-Paper software.
Developments in the International<br />
and Euro Area Economy<br />
<strong>Quarterly</strong> <strong>Bulletin</strong> 03 / July 13<br />
65<br />
the higher end of the central bank’s target of 4.5<br />
per cent plus or minus 2 percentage points. The<br />
central bank’s main policy rate, the Selic, was<br />
increased by 25 basis points in April and by 50<br />
basis points to 8.0 per cent in May.<br />
In India, GDP at factor cost increased by 4.8<br />
per cent on a year-on-year basis during the first<br />
quarter of <strong>2013</strong>, little changed from the 4.7 per<br />
cent increase recorded during the fourth quarter<br />
of 2012. Inflation, as measured on an annualised<br />
basis by the wholesale price index, dropped<br />
from close to 6 per cent in March to 4.9 per cent<br />
in April and coincided with a drop in fuel and<br />
power prices. The Reserve Bank of India cut<br />
its key policy rate by 25 basis points in March<br />
and again in May to 7.25 per cent. In Russia,<br />
activity continued to slow and according to the<br />
flash estimate GDP expanded by 1.6 per cent<br />
on an annualised basis during the first quarter<br />
of <strong>2013</strong>, following growth of 2.1 per cent in the<br />
final quarter of 2012. Inflation remains high and<br />
increased from 7 per cent in March to 7.4 per<br />
cent in May, driven mostly by food prices.<br />
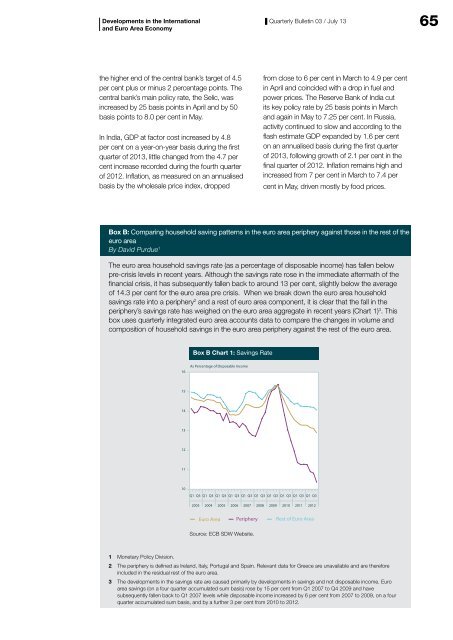
Box B: Comparing household saving patterns in the euro area periphery against those in the rest of the<br />
euro area<br />
By David Purdue 1<br />
The euro area household savings rate (as a percentage of disposable income) has fallen below<br />
pre-crisis levels in recent years. Although the savings rate rose in the immediate aftermath of the<br />
financial crisis, it has subsequently fallen back to around 13 per cent, slightly below the average<br />
of 14.3 per cent for the euro area pre crisis. When we break down the euro area household<br />
savings rate into a periphery 2 and a rest of euro area component, it is clear that the fall in the<br />
periphery’s savings rate has weighed on the euro area aggregate in recent years (Chart 1) 3 . This<br />
box uses quarterly integrated euro area accounts data to compare the changes in volume and<br />
composition of household savings in the euro area periphery against the rest of the euro area.<br />
Box B Chart 1: Savings Rate<br />
16<br />
As Percentage of Disposable Income<br />
15<br />
14<br />
13<br />
12<br />
11<br />
10<br />
Q1 <strong>Q3</strong> Q1 <strong>Q3</strong> Q1 <strong>Q3</strong> Q1 <strong>Q3</strong> Q1 <strong>Q3</strong> Q1 <strong>Q3</strong> Q1 <strong>Q3</strong> Q1 <strong>Q3</strong> Q1 <strong>Q3</strong> Q1 <strong>Q3</strong><br />
2003 2004 2005 2006 2007 2008 2009 2010 2011 2012<br />
Euro Area<br />
Periphery<br />
Rest of Euro Area<br />
Source: ECB SDW Website.<br />
1 Monetary Policy Division.<br />
2 The periphery is defined as Ireland, Italy, Portugal and Spain. Relevant data for Greece are unavailable and are therefore<br />
included in the residual rest of the euro area.<br />
3 The developments in the savings rate are caused primarily by developments in savings and not disposable income. Euro<br />
area savings (on a four quarter accumulated sum basis) rose by 15 per cent from Q1 2007 to Q4 2009 and have<br />
subsequently fallen back to Q1 2007 levels while disposable income increased by 6 per cent from 2007 to 2009, on a four<br />
quarter accumulated sum basis, and by a further 3 per cent from 2010 to 2012.