Quarterly Bulletin Q3 2013
Quarterly Bulletin Q3 2013
Quarterly Bulletin Q3 2013

Create successful ePaper yourself
Turn your PDF publications into a flip-book with our unique Google optimized e-Paper software.
42<br />
Financing Developments<br />
<strong>Quarterly</strong> <strong>Bulletin</strong> 03 / July 13<br />
in the Irish Economy<br />
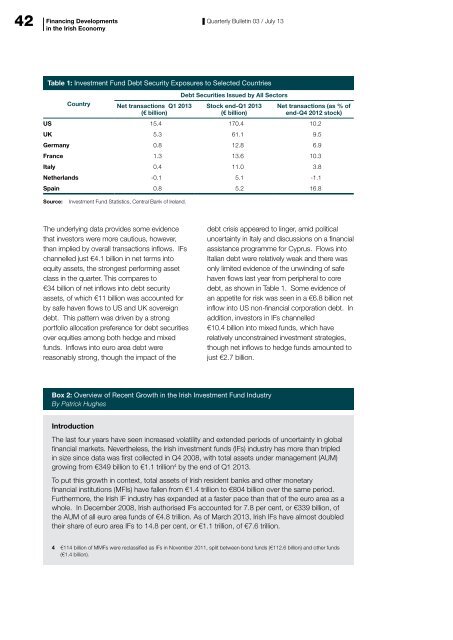
Table 1: Investment Fund Debt Security Exposures to Selected Countries<br />
Country<br />
Net transactions Q1 <strong>2013</strong><br />
(€ billion)<br />
Debt Securities Issued by All Sectors<br />
Stock end-Q1 <strong>2013</strong><br />
(€ billion)<br />
Net transactions (as % of<br />
end-Q4 2012 stock)<br />
US 15.4 170.4 10.2<br />
UK 5.3 61.1 9.5<br />
Germany 0.8 12.8 6.9<br />
France 1.3 13.6 10.3<br />
Italy 0.4 11.0 3.8<br />
Netherlands -0.1 5.1 -1.1<br />
Spain 0.8 5.2 16.8<br />
Source:<br />
Investment Fund Statistics, Central Bank of Ireland.<br />
The underlying data provides some evidence<br />
that investors were more cautious, however,<br />
than implied by overall transactions inflows. IFs<br />
channelled just €4.1 billion in net terms into<br />
equity assets, the strongest performing asset<br />
class in the quarter. This compares to<br />
€34 billion of net inflows into debt security<br />
assets, of which €11 billion was accounted for<br />
by safe haven flows to US and UK sovereign<br />
debt. This pattern was driven by a strong<br />
portfolio allocation preference for debt securities<br />
over equities among both hedge and mixed<br />
funds. Inflows into euro area debt were<br />
reasonably strong, though the impact of the<br />
debt crisis appeared to linger, amid political<br />
uncertainty in Italy and discussions on a financial<br />
assistance programme for Cyprus. Flows into<br />
Italian debt were relatively weak and there was<br />
only limited evidence of the unwinding of safe<br />
haven flows last year from peripheral to core<br />
debt, as shown in Table 1. Some evidence of<br />
an appetite for risk was seen in a €6.8 billion net<br />
inflow into US non-financial corporation debt. In<br />
addition, investors in IFs channelled<br />
€10.4 billion into mixed funds, which have<br />
relatively unconstrained investment strategies,<br />
though net inflows to hedge funds amounted to<br />
just €2.7 billion.<br />
Box 2: Overview of Recent Growth in the Irish Investment Fund Industry<br />
By Patrick Hughes<br />
Introduction<br />
The last four years have seen increased volatility and extended periods of uncertainty in global<br />
financial markets. Nevertheless, the Irish investment funds (IFs) industry has more than tripled<br />
in size since data was first collected in Q4 2008, with total assets under management (AUM)<br />
growing from €349 billion to €1.1 trillion 4 by the end of Q1 <strong>2013</strong>.<br />
To put this growth in context, total assets of Irish resident banks and other monetary<br />
financial institutions (MFIs) have fallen from €1.4 trillion to €804 billion over the same period.<br />
Furthermore, the Irish IF industry has expanded at a faster pace than that of the euro area as a<br />
whole. In December 2008, Irish authorised IFs accounted for 7.8 per cent, or €339 billion, of<br />
the AUM of all euro area funds of €4.8 trillion. As of March <strong>2013</strong>, Irish IFs have almost doubled<br />
their share of euro area IFs to 14.8 per cent, or €1.1 trillion, of €7.6 trillion.<br />
4 €114 billion of MMFs were reclassified as IFs in November 2011, split between bond funds (€112.6 billion) and other funds<br />
(€1.4 billion).