Quarterly Bulletin Q3 2013
Quarterly Bulletin Q3 2013
Quarterly Bulletin Q3 2013

You also want an ePaper? Increase the reach of your titles
YUMPU automatically turns print PDFs into web optimized ePapers that Google loves.
Analysis of Recent Monetary Operations &<br />
Financial Market Developments<br />
<strong>Quarterly</strong> <strong>Bulletin</strong> 03 / July 13<br />
91<br />
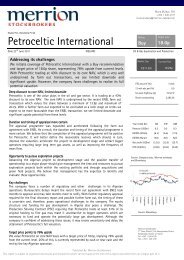
Chart 3: Eurosystem Outstanding Lending<br />
Chart 4: MRO and LTRO Borrowings<br />
1,400<br />
€ bn<br />
2nd 3-year<br />
LTRO<br />
1st ERO of 1st<br />
3-year LTRO<br />
1,400<br />
€ bn<br />
1,200<br />
1st 3-year<br />
LTRO<br />
1,200<br />
1,000<br />
1,000<br />
800<br />
1st ERO of 2nd<br />
3-year LTRO<br />
800<br />
600<br />
600<br />
400<br />
400<br />
200<br />
200<br />
0<br />
Dec Jan Feb Mar Apr May Jun Jul Aug Sep Oct Nov Dec Jan Feb Mar Apr May<br />
0<br />
Jan Feb Mar Apr May Jun Jul Aug Sep Oct Nov Dec Jan Feb Mar Apr May<br />
2011 2012 <strong>2013</strong><br />
2012 <strong>2013</strong><br />
Surplus / Excess Liquidity<br />
Liquidity Shortage<br />
Liquidity provided<br />
MRO MRO + LTROs 3-year LTROs<br />
LTROs (Ex 3-year LTROs)<br />
*Please refer to Annex 1 for a full glossary of terms.<br />
Sources: ECB, own calculations.<br />
*Please refer to Annex 1 for a full glossary of terms.<br />
Sources: ECB, own calculations.<br />
the composition of Eurosystem borrowing<br />
for the remainder of 2012, and at year-end<br />
LTRO borrowings accounted for 91% of<br />
total borrowing, MRO borrowings 8% and<br />
USD borrowings had fallen to 1% of overall<br />
borrowings 16 . Chart 4 illustrates MRO and<br />
LTRO borrowings since January 2012.<br />
3.1 3-Year Longer Term Refinancing<br />
Operations (LTROs)<br />
The major changes in Eurosystem lending over<br />
the last 18 months have been dominated by<br />
the allotment 17 and subsequent repayment<br />
of the 3-year LTROs. The first 3-year LTRO<br />
was conducted in December 2011 with 523<br />
bidders allotted €489bn, above the median<br />
Reuters poll estimate of €310bn, while the<br />
second 3-year was conducted on 29 February<br />
2012 with 800 bidders allotted €530bn, again<br />
above the median estimate Reuters poll of<br />
€500bn. In total, €1,019bn was allotted in<br />
the two 3-year LTROs, with a net liquidity<br />
addition of €525bn, as some counterparties<br />
switched from shorter dated operations.<br />
The large amount allotted across both of<br />
these operations kept outstanding liquidity at<br />
historically elevated levels for the remainder of<br />
2012.<br />
Market reaction to the 3-year operations was<br />
largely positive, with the general belief that the<br />
increased level of liquidity in the system would<br />
reduce funding risks for banks, particularly as<br />
they faced large debt redemption pressures<br />
in 2012 (reportedly €230bn in Q1). However,<br />
others interpreted the large participation in the<br />
operations as a sign that banks expected the<br />
distressed borrowing conditions to continue.<br />
Reports also suggested that the high take-up<br />
could allow banks to engage in carry trades<br />
in which they would use the Eurosystem<br />
funds to purchase higher yielding government<br />
bonds, particularly shorter dated issues which<br />
would closely match the maturity term of the<br />
operation.<br />
16 Pre-crisis, the main source of liquidity in ECB OMOs was through the MRO (73% of the total borrowings in 2006). However since<br />
the crisis, banks now have a preference for longer term funding.<br />
17 The two 3-year LTROs were conducted as fixed rate full allotment operations and were indexed to the average MRO rate over the<br />
lifetime of the operation.