

Household Production and Consumption in Finland 2001
Household Production and Consumption in Finland 2001
Household Production and Consumption in Finland 2001

Create successful ePaper yourself
Turn your PDF publications into a flip-book with our unique Google optimized e-Paper software.
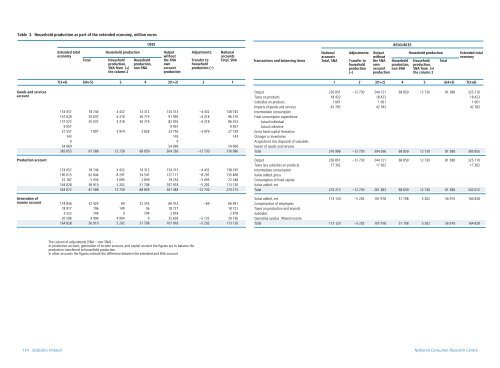
Table 3. <strong>Household</strong> production as part of the extended economy, million euros<br />
USES<br />
RESOURCES<br />
Extended total<br />
economy<br />
Total<br />
<strong>Household</strong> production<br />
<strong>Household</strong><br />
production,<br />
SNA from (+)<br />
the column 2<br />
<strong>Household</strong><br />
production,<br />
non-SNA<br />
Output<br />
without<br />
the SNA<br />
own<br />
account<br />
production<br />
Adjustments:<br />
Transfer to<br />
household<br />
production (–)<br />
National<br />
accounts<br />
Total, SNA<br />
National Adjustments:<br />
accounts<br />
Transactions <strong>and</strong> balans<strong>in</strong>g items Total, SNA Transfer to<br />
household<br />
production<br />
(–)<br />
Output<br />
without<br />
the SNA <strong>Household</strong><br />
own production,<br />
account non-SNA<br />
production<br />
<strong>Household</strong> production<br />
<strong>Household</strong><br />
production,<br />
SNA from (+)<br />
the column 2<br />
Total<br />
Extended total<br />
economy<br />
Goods <strong>and</strong> services<br />
account<br />
<strong>Production</strong> account<br />
7(3+6) 6(4+5) 5 4 3(1+2) 2 1<br />
153 057 18 744 4 432 14 312 134 313 –4 432 138 745<br />
147 029 55 037 4 318 50 719 91 992 –4 318 96 310<br />
137 072 55 037 4 318 50 719 82 035 –4 318 86 353<br />
9 957 9 957 9 957<br />
31 557 7 807 3 979 3 828 23 750 –3 979 27 729<br />
143 143 143<br />
0 0<br />
54 069 54 069 54 069<br />
385 855 81 588 12 730 68 859 304 266 –12 730 316 996<br />
153 057 18 744 4 432 14 312 134 313 –4 432 138 745<br />
190 015 62 844 8 297 54 547 127 171 –8 297 135 468<br />
25 187 5 934 3 095 2 839 19 253 –3 095 22 348<br />
164 828 56 910 5 202 51 708 107 918 –5 202 113 120<br />
343 072 81 588 12 730 68 859 261 483 –12 730 274 213<br />
1 2 3(1+2) 4 5 6(4+5) 7(3+6)<br />
Output 256 851 –12 730 244 121 68 859 12 730 81 588 325 710<br />
Taxes on products 18 423 18 423 18 423<br />
Subsidies on products 1 061 1 061 1 061<br />
Imports of goods <strong>and</strong> services 42 783 42 783 42 783<br />
Intermediate consumption<br />
F<strong>in</strong>al consumption expenditure<br />
Actual <strong>in</strong>dividual<br />
Actual collective<br />
Gross fixed capital formation<br />
Changes <strong>in</strong> <strong>in</strong>ventories<br />
Acquisitions less disposals of valuables<br />
Export of goods <strong>and</strong> services<br />
Total 316 996 –12 730 304 266 68 859 12 730 81 588 385 855<br />
Output 256 851 –12 730 244 121 68 859 12 730 81 588 325 710<br />
Taxes less subsidies on products 17 362 17 362 17 362<br />
Intermediate consumption<br />
Value added, gross<br />
<strong>Consumption</strong> of fixed capital<br />
Value added, net<br />
Total 274 213 –12 730 261 483 68 859 12 730 81 588 343 072<br />
Generation of<br />
<strong>in</strong>come account 118 836 52 424 69 52 355 66 412 –69 66 481<br />
18 917 196 140 56 18 721 18 721<br />
3 522 704 0 704 2 818 2 818<br />
30 596 4 994 4 994 0 25 603 –5 133 30 736<br />
164 828 56 910 5 202 51 708 107 918 –5 202 113 120<br />
Value added, net 113 120 –5 202 107 918 51 708 5 202 56 910 164 828<br />
Compensation of employees<br />
Taxes on production <strong>and</strong> imports<br />
Subsidies<br />
Operat<strong>in</strong>g surplus /Mixed <strong>in</strong>come<br />
Total 113 120 –5 202 107 918 51 708 5 202 56 910 164 828<br />
The column of adjustments (SNA – non-SNA) :<br />
In production account, generation of <strong>in</strong>come account, <strong>and</strong> capital account the figures are to balance the<br />
production transferred to household production<br />
In other accounts the figures <strong>in</strong>dicate the difference between the extended <strong>and</strong> SNA-account<br />
114 Statistics F<strong>in</strong>l<strong>and</strong> National Consumer Research Centre


