

Household Production and Consumption in Finland 2001
Household Production and Consumption in Finland 2001
Household Production and Consumption in Finland 2001

You also want an ePaper? Increase the reach of your titles
YUMPU automatically turns print PDFs into web optimized ePapers that Google loves.
6 <strong>Household</strong> production <strong>in</strong> different<br />
types ofhouseholds<br />
In Chapter 5 above, household production was exam<strong>in</strong>ed at the national level.<br />
The discussion below describes household production <strong>in</strong> different types of<br />
households. In this analysis the figures can be presented <strong>in</strong> two different ways.<br />
First, we can look at the amount of production <strong>in</strong> one <strong>in</strong>dividual household<br />
<strong>and</strong> at how it breaks down between different pr<strong>in</strong>cipal functions <strong>in</strong> different<br />
types of households. This is a micro-level analysis. Secondly, we can exam<strong>in</strong>e<br />
different household types at the level of the national economy, <strong>in</strong> which case<br />
the results will also depend on the overall number of that particular type of<br />
household <strong>in</strong> the country. This approach allows us to compare the household<br />
production of, say, pensioner households <strong>and</strong> work<strong>in</strong>g-age households at the<br />
national level. The production <strong>and</strong> generation of <strong>in</strong>come accounts for each<br />
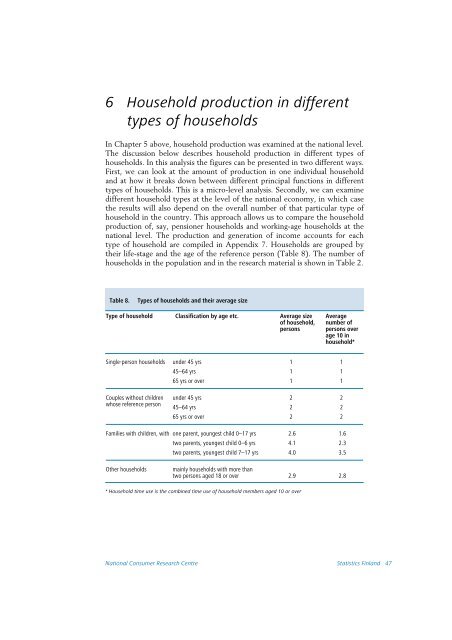
type of household are compiled <strong>in</strong> Appendix 7. <strong>Household</strong>s are grouped by<br />
their life-stage <strong>and</strong> the age of the reference person (Table 8). The number of<br />
households <strong>in</strong> the population <strong>and</strong> <strong>in</strong> the research material is shown <strong>in</strong> Table 2.<br />
Table 8.<br />
Types of households <strong>and</strong> their average size<br />
Type of household Classification by age etc. Average size<br />
of household,<br />
persons<br />
Average<br />
number of<br />
persons over<br />
age 10 <strong>in</strong><br />
household*<br />
S<strong>in</strong>gle-person households under 45 yrs 1 1<br />
45–64 yrs 1 1<br />
65 yrs or over 1 1<br />
Couples without children<br />
whose reference person<br />
under 45 yrs 2 2<br />
45–64 yrs 2 2<br />
65 yrs or over 2 2<br />
Families with children, with one parent, youngest child 0–17 yrs 2.6 1.6<br />
two parents, youngest child 0–6 yrs 4.1 2.3<br />
two parents, youngest child 7–17 yrs 4.0 3.5<br />
Other households<br />
ma<strong>in</strong>ly households with more than<br />
two persons aged 18 or over 2.92.8<br />
* <strong>Household</strong> time use is the comb<strong>in</strong>ed time use of household members aged 10 or over<br />
National Consumer Research Centre Statistics F<strong>in</strong>l<strong>and</strong> 47


