

Household Production and Consumption in Finland 2001
Household Production and Consumption in Finland 2001
Household Production and Consumption in Finland 2001

Create successful ePaper yourself
Turn your PDF publications into a flip-book with our unique Google optimized e-Paper software.
household data are collected <strong>in</strong> computer-aided personal <strong>in</strong>terviews <strong>and</strong> by<br />
means of diaries <strong>in</strong> which households keep a record of their consumption<br />
expenditure over a two-week period. Data on <strong>in</strong>come are obta<strong>in</strong>ed from<br />
adm<strong>in</strong>istrative registers. The latest dataset cover<strong>in</strong>g some 5,500 households<br />
was compiled <strong>in</strong> <strong>2001</strong>–2002. The Satellite Account was compiled us<strong>in</strong>g this<br />
dataset. A more detailed description of the <strong>Household</strong> Budget Survey datasets<br />
<strong>and</strong> methods is available <strong>in</strong> Kulutustutkimus <strong>2001</strong>–2002. Laatuselvitys<br />
(Tilastokeskus 2004; <strong>in</strong> F<strong>in</strong>nish).<br />
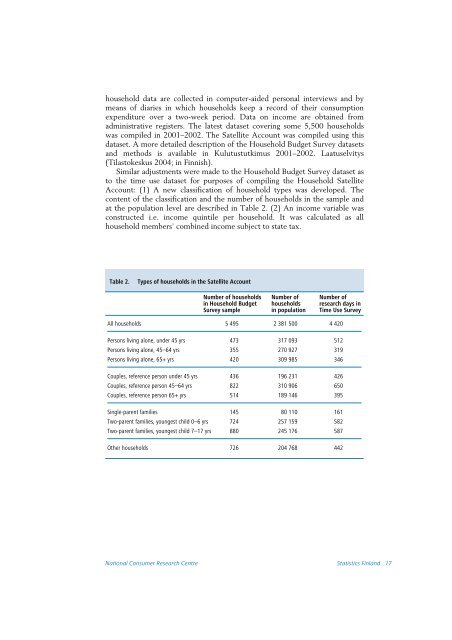
Similar adjustments were made to the <strong>Household</strong> Budget Survey dataset as<br />
to the time use dataset for purposes of compil<strong>in</strong>g the <strong>Household</strong> Satellite<br />
Account: (1) A new classification of household types was developed. The<br />
content of the classification <strong>and</strong> the number of households <strong>in</strong> the sample <strong>and</strong><br />
at the population level are described <strong>in</strong> Table 2. (2) An <strong>in</strong>come variable was<br />
constructed i.e. <strong>in</strong>come qu<strong>in</strong>tile per household. It was calculated as all<br />
household members’ comb<strong>in</strong>ed <strong>in</strong>come subject to state tax.<br />
Table 2.<br />
Types of households <strong>in</strong> the Satellite Account<br />
Number of households<br />
<strong>in</strong> <strong>Household</strong> Budget<br />
Survey sample<br />
Number of<br />
households<br />
<strong>in</strong> population<br />
Number of<br />
research days <strong>in</strong><br />
Time Use Survey<br />
All households 5 495 2 381 500 4 420<br />
Persons liv<strong>in</strong>g alone, under 45 yrs 473 317 093 512<br />
Persons liv<strong>in</strong>g alone, 45–64 yrs 355 270 927 319<br />
Persons liv<strong>in</strong>g alone, 65+ yrs 420 309 985 346<br />
Couples, reference person under 45 yrs 436 196 231 426<br />
Couples, reference person 45–64 yrs 822 310 906 650<br />
Couples, reference person 65+ yrs 514 189 146 395<br />
S<strong>in</strong>gle-parent families 145 80 110 161<br />
Two-parent families, youngest child 0–6 yrs 724 257 159582<br />
Two-parent families, youngest child 7–17 yrs 880 245 176 587<br />
Other households 726 204 768 442<br />
National Consumer Research Centre Statistics F<strong>in</strong>l<strong>and</strong> 17


