Household Production and Consumption in Finland 2001
Household Production and Consumption in Finland 2001
Household Production and Consumption in Finland 2001
Create successful ePaper yourself
Turn your PDF publications into a flip-book with our unique Google optimized e-Paper software.
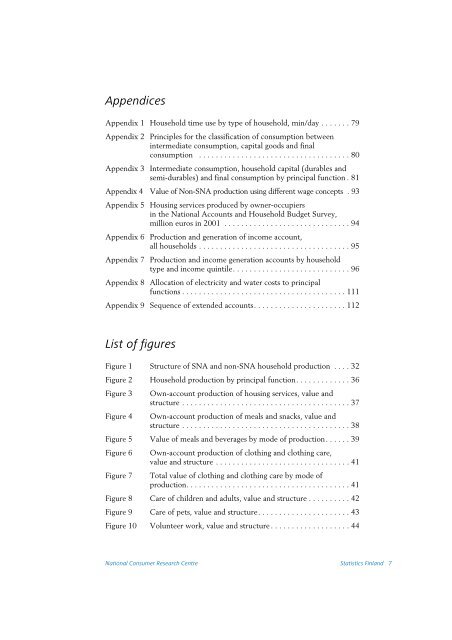
Appendices<br />
Appendix 1 <strong>Household</strong> time use by type of household, m<strong>in</strong>/day . . . . . . . 79<br />
Appendix 2 Pr<strong>in</strong>ciples for the classification of consumption between<br />
<strong>in</strong>termediate consumption, capital goods <strong>and</strong> f<strong>in</strong>al<br />
consumption . . . . . . . . . . . . . . . . . . . . . . . . . . . . . . . . . . . . 80<br />
Appendix 3 Intermediate consumption, household capital (durables <strong>and</strong><br />
semi-durables) <strong>and</strong> f<strong>in</strong>al consumption by pr<strong>in</strong>cipal function . 81<br />
Appendix 4 Value of Non-SNA production us<strong>in</strong>g different wage concepts . 93<br />
Appendix 5 Hous<strong>in</strong>g services produced by owner-occupiers<br />
<strong>in</strong> the National Accounts <strong>and</strong> <strong>Household</strong> Budget Survey,<br />
million euros <strong>in</strong> <strong>2001</strong> . . . . . . . . . . . . . . . . . . . . . . . . . . . . . . 94<br />
Appendix 6 <strong>Production</strong> <strong>and</strong> generation of <strong>in</strong>come account,<br />
all households . . . . . . . . . . . . . . . . . . . . . . . . . . . . . . . . . . . . 95<br />
Appendix 7 <strong>Production</strong> <strong>and</strong> <strong>in</strong>come generation accounts by household<br />
type <strong>and</strong> <strong>in</strong>come qu<strong>in</strong>tile. . . . . . . . . . . . . . . . . . . . . . . . . . . . 96<br />
Appendix 8 Allocation of electricity <strong>and</strong> water costs to pr<strong>in</strong>cipal<br />
functions . . . . . . . . . . . . . . . . . . . . . . . . . . . . . . . . . . . . . . . 111<br />
Appendix 9 Sequence of extended accounts. . . . . . . . . . . . . . . . . . . . . . 112<br />
List offigures<br />
Figure 1 Structure of SNA <strong>and</strong> non-SNA household production . . . . 32<br />
Figure 2 <strong>Household</strong> production by pr<strong>in</strong>cipal function. . . . . . . . . . . . . 36<br />
Figure 3 Own-account production of hous<strong>in</strong>g services, value <strong>and</strong><br />
structure . . . . . . . . . . . . . . . . . . . . . . . . . . . . . . . . . . . . . . . . 37<br />
Figure 4 Own-account production of meals <strong>and</strong> snacks, value <strong>and</strong><br />
structure . . . . . . . . . . . . . . . . . . . . . . . . . . . . . . . . . . . . . . . . 38<br />
Figure 5 Value of meals <strong>and</strong> beverages by mode of production. . . . . . 39<br />
Figure 6 Own-account production of cloth<strong>in</strong>g <strong>and</strong> cloth<strong>in</strong>g care,<br />
value <strong>and</strong> structure . . . . . . . . . . . . . . . . . . . . . . . . . . . . . . . . 41<br />
Figure 7 Total value of cloth<strong>in</strong>g <strong>and</strong> cloth<strong>in</strong>g care by mode of<br />
production. . . . . . . . . . . . . . . . . . . . . . . . . . . . . . . . . . . . . . . 41<br />
Figure 8 Care of children <strong>and</strong> adults, value <strong>and</strong> structure . . . . . . . . . . 42<br />
Figure 9 Care of pets, value <strong>and</strong> structure. . . . . . . . . . . . . . . . . . . . . . 43<br />
Figure 10 Volunteer work, value <strong>and</strong> structure . . . . . . . . . . . . . . . . . . . 44<br />
National Consumer Research Centre Statistics F<strong>in</strong>l<strong>and</strong> 7


