Letter To Shareholders - Mitac
Letter To Shareholders - Mitac
Letter To Shareholders - Mitac

You also want an ePaper? Increase the reach of your titles
YUMPU automatically turns print PDFs into web optimized ePapers that Google loves.
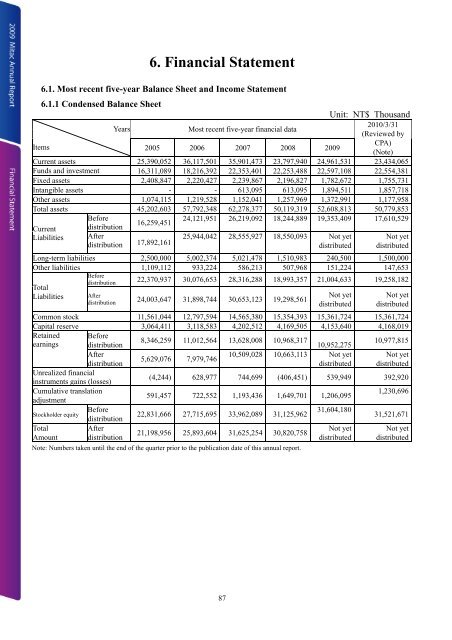
6. Financial Statement<br />
6.1. Most recent five-year Balance Sheet and Income Statement<br />
6.1.1 Condensed Balance Sheet<br />
Unit: NT$ Thousand<br />
Years<br />
Most recent five-year financial data<br />
2010/3/31<br />
(Reviewed by<br />
Items 2005 2006 2007 2008 2009<br />
CPA)<br />
(Note)<br />
Current assets 25,390,052 36,117,501 35,901,473 23,797,940 24,961,531 23,434,065<br />
Funds and investment 16,311,089 18,216,392 22,353,401 22,253,488 22,597,108 22,554,381<br />
Fixed assets 2,408,847 2,220,427 2,239,867 2,196,827 1,782,672 1,755,731<br />
Intangible assets - - 613,095 613,095 1,894,511 1,857,718<br />
Other assets 1,074,115 1,219,528 1,152,041 1,257,969 1,372,991 1,177,958<br />
<strong>To</strong>tal assets 45,202,603 57,792,348 62,278,377 50,119,319 52,608,813 50,779,853<br />
Before<br />
24,121,951 26,219,092 18,244,889 19,353,409 17,610,529<br />
16,259,451<br />
Current distribution<br />
Liabilities<br />
After<br />
distribution 17,892,161<br />
25,944,042 28,555,927 18,550,093 Not yet<br />
distributed<br />
Not yet<br />
distributed<br />
Long-term liabilities 2,500,000 5,002,374 5,021,478 1,510,983 240,500 1,500,000<br />
Other liabilities 1,109,112 933,224 586,213 507,968 151,224 147,653<br />
Before<br />
distribution<br />
22,370,937 30,076,653 28,316,288 18,993,357 21,004,633 19,258,182<br />
<strong>To</strong>tal<br />
Liabilities<br />
After<br />
distribution<br />
24,003,647 31,898,744 30,653,123 19,298,561<br />
Not yet<br />
distributed<br />
Not yet<br />
distributed<br />
Common stock 11,561,044 12,797,594 14,565,380 15,354,393 15,361,724 15,361,724<br />
Capital reserve 3,064,411 3,118,583 4,202,512 4,169,505 4,153,640 4,168,019<br />
Retained Before<br />
8,346,259 11,012,564 13,628,008 10,968,317<br />
earnings distribution<br />
10,952,275<br />
10,977,815<br />
After<br />
10,509,028 10,663,113 Not yet Not yet<br />
5,629,076 7,979,746<br />
distribution<br />
distributed distributed<br />
Unrealized financial<br />
instruments gains (losses)<br />
(4,244) 628,977 744,699 (406,451) 539,949 392,920<br />
Cumulative translation<br />
1,230,696<br />
591,457 722,552 1,193,436 1,649,701 1,206,095<br />
adjustment<br />
Stockholder equity<br />
Before<br />
31,604,180<br />
22,831,666 27,715,695 33,962,089 31,125,962<br />
distribution<br />
31,521,671<br />
<strong>To</strong>tal<br />
After<br />
Not yet Not yet<br />
21,198,956 25,893,604 31,625,254 30,820,758<br />
Amount distribution<br />
distributed distributed<br />
Note: Numbers taken until the end of the quarter prior to the publication date of this annual report.<br />
87