Spectroscopy in a Suitcase - Royal Society of Chemistry
Spectroscopy in a Suitcase - Royal Society of Chemistry
Spectroscopy in a Suitcase - Royal Society of Chemistry

You also want an ePaper? Increase the reach of your titles
YUMPU automatically turns print PDFs into web optimized ePapers that Google loves.
ULTRAVIOLET - VISIBLE SPECTROSCOPY (UV)<br />
EXERCISE 2 - REACTION OF BLUE FOOD DYE WITH BLEACH 4<br />
METHOD<br />
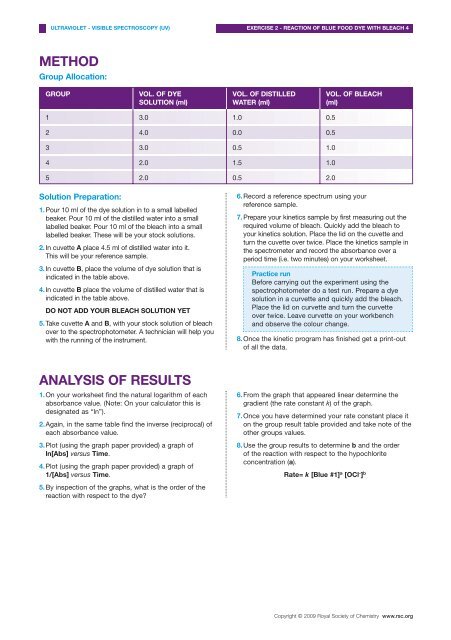
Group Allocation:<br />
GROUP<br />
VOL. OF DYE<br />
SOLUTION (ml)<br />
VOL. OF DISTILLED<br />
WATER (ml)<br />
VOL. OF BLEACH<br />
(ml)<br />
1 3.0 1.0 0.5<br />
2 4.0 0.0 0.5<br />
3 3.0 0.5 1.0<br />
4 2.0 1.5 1.0<br />
5 2.0 0.5 2.0<br />
Solution Preparation:<br />
1. Pour 10 ml <strong>of</strong> the dye solution <strong>in</strong> to a small labelled<br />
beaker. Pour 10 ml <strong>of</strong> the distilled water <strong>in</strong>to a small<br />
labelled beaker. Pour 10 ml <strong>of</strong> the bleach <strong>in</strong>to a small<br />
labelled beaker. These will be your stock solutions.<br />
2. In cuvette A place 4.5 ml <strong>of</strong> distilled water <strong>in</strong>to it.<br />
This will be your reference sample.<br />
3. In cuvette B, place the volume <strong>of</strong> dye solution that is<br />
<strong>in</strong>dicated <strong>in</strong> the table above.<br />
4. In cuvette B place the volume <strong>of</strong> distilled water that is<br />
<strong>in</strong>dicated <strong>in</strong> the table above.<br />
DO NOT ADD YOUR BLEACH SOLUTION YET<br />
5. Take cuvette A and B, with your stock solution <strong>of</strong> bleach<br />
over to the spectrophotometer. A technician will help you<br />
with the runn<strong>in</strong>g <strong>of</strong> the <strong>in</strong>strument.<br />
6. Record a reference spectrum us<strong>in</strong>g your<br />
reference sample.<br />
7. Prepare your k<strong>in</strong>etics sample by first measur<strong>in</strong>g out the<br />
required volume <strong>of</strong> bleach. Quickly add the bleach to<br />
your k<strong>in</strong>etics solution. Place the lid on the cuvette and<br />
turn the cuvette over twice. Place the k<strong>in</strong>etics sample <strong>in</strong><br />
the spectrometer and record the absorbance over a<br />
period time (i.e. two m<strong>in</strong>utes) on your worksheet.<br />
Practice run<br />
Before carry<strong>in</strong>g out the experiment us<strong>in</strong>g the<br />
spectrophotometer do a test run. Prepare a dye<br />
solution <strong>in</strong> a curvette and quickly add the bleach.<br />
Place the lid on curvette and turn the curvette<br />
over twice. Leave curvette on your workbench<br />
and observe the colour change.<br />
8. Once the k<strong>in</strong>etic program has f<strong>in</strong>ished get a pr<strong>in</strong>t-out<br />
<strong>of</strong> all the data.<br />
ANALYSIS OF RESULTS<br />
1.On your worksheet f<strong>in</strong>d the natural logarithm <strong>of</strong> each<br />
absorbance value. (Note: On your calculator this is<br />
designated as “ln”).<br />
2.Aga<strong>in</strong>, <strong>in</strong> the same table f<strong>in</strong>d the <strong>in</strong>verse (reciprocal) <strong>of</strong><br />
each absorbance value.<br />
3.Plot (us<strong>in</strong>g the graph paper provided) a graph <strong>of</strong><br />
ln[Abs] versus Time.<br />
4.Plot (us<strong>in</strong>g the graph paper provided) a graph <strong>of</strong><br />
1/[Abs] versus Time.<br />
6.From the graph that appeared l<strong>in</strong>ear determ<strong>in</strong>e the<br />
gradient (the rate constant k) <strong>of</strong> the graph.<br />
7.Once you have determ<strong>in</strong>ed your rate constant place it<br />
on the group result table provided and take note <strong>of</strong> the<br />
other groups values.<br />
8.Use the group results to determ<strong>in</strong>e b and the order<br />
<strong>of</strong> the reaction with respect to the hypochlorite<br />
concentration (a).<br />
Rate= k [Blue #1] a [OCl - ] b<br />
5.By <strong>in</strong>spection <strong>of</strong> the graphs, what is the order <strong>of</strong> the<br />
reaction with respect to the dye?<br />
Copyright © 2009 <strong>Royal</strong> <strong>Society</strong> <strong>of</strong> <strong>Chemistry</strong> www.rsc.org