Spectroscopy in a Suitcase - Royal Society of Chemistry
Spectroscopy in a Suitcase - Royal Society of Chemistry
Spectroscopy in a Suitcase - Royal Society of Chemistry

Create successful ePaper yourself
Turn your PDF publications into a flip-book with our unique Google optimized e-Paper software.
ULTRAVIOLET - VISIBLE SPECTROSCOPY (UV)<br />
INTRODUCTION 3<br />
If a substance<br />
absorbs here...<br />
495 nm<br />
190 nm<br />
450 nm<br />
Blue<br />
UV Region<br />
Violet<br />
Red<br />
Visible Region Colour Wheel<br />
Green<br />
570 nm<br />
Yellow<br />
400 nm<br />
800 nm - Visible Region<br />
Orange<br />
590 nm<br />
400 nm<br />
620 nm<br />
...it appears<br />
as this colour<br />
Red<br />
Orange<br />
Yellow<br />
Green<br />
Blue<br />
Violet<br />
620-750 nm<br />
590-620 nm<br />
570-590 nm<br />
496-570 nm<br />
450-495 nm<br />
380-450 nm<br />
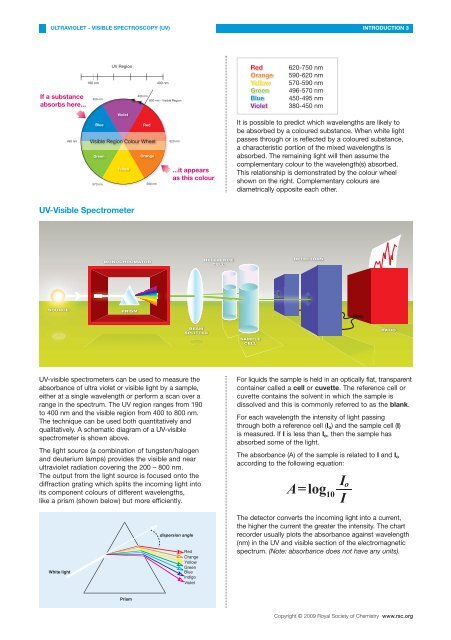
It is possible to predict which wavelengths are likely to<br />
be absorbed by a coloured substance. When white light<br />
passes through or is reflected by a coloured substance,<br />
a characteristic portion <strong>of</strong> the mixed wavelengths is<br />
absorbed. The rema<strong>in</strong><strong>in</strong>g light will then assume the<br />
complementary colour to the wavelength(s) absorbed.<br />
This relationship is demonstrated by the colour wheel<br />
shown on the right. Complementary colours are<br />
diametrically opposite each other.<br />
Red<br />
UV-Visible Spectrometer<br />
Orange<br />
Yellow<br />
Green<br />
Blue<br />
Violet<br />
MONOCHROMATOR<br />
REFERENCE<br />
CELL<br />
DETECTORS<br />
SOURCE<br />
PRISM<br />
BEAM<br />
SPLITTER<br />
SAMPLE<br />
CELL<br />
RATIO<br />
UV-visible spectrometers can be used to measure the<br />
absorbance <strong>of</strong> ultra violet or visible light by a sample,<br />
either at a s<strong>in</strong>gle wavelength or perform a scan over a<br />
range <strong>in</strong> the spectrum. The UV region ranges from 190<br />
to 400 nm and the visible region from 400 to 800 nm.<br />
The technique can be used both quantitatively and<br />
qualitatively. A schematic diagram <strong>of</strong> a UV-visible<br />
spectrometer is shown above.<br />
The light source (a comb<strong>in</strong>ation <strong>of</strong> tungsten/halogen<br />
and deuterium lamps) provides the visible and near<br />
ultraviolet radiation cover<strong>in</strong>g the 200 – 800 nm.<br />
The output from the light source is focused onto the<br />
diffraction grat<strong>in</strong>g which splits the <strong>in</strong>com<strong>in</strong>g light <strong>in</strong>to<br />
its component colours <strong>of</strong> different wavelengths,<br />
like a prism (shown below) but more efficiently.<br />
For liquids the sample is held <strong>in</strong> an optically flat, transparent<br />
conta<strong>in</strong>er called a cell or cuvette. The reference cell or<br />
cuvette conta<strong>in</strong>s the solvent <strong>in</strong> which the sample is<br />
dissolved and this is commonly referred to as the blank.<br />
For each wavelength the <strong>in</strong>tensity <strong>of</strong> light pass<strong>in</strong>g<br />
through both a reference cell (I o ) and the sample cell (I)<br />
is measured. If I is less than I o , then the sample has<br />
absorbed some <strong>of</strong> the light.<br />
The absorbance (A) <strong>of</strong> the sample is related to I and I o<br />
accord<strong>in</strong>g to the follow<strong>in</strong>g equation:<br />
The detector converts the <strong>in</strong>com<strong>in</strong>g light <strong>in</strong>to a current,<br />
the higher the current the greater the <strong>in</strong>tensity. The chart<br />
recorder usually plots the absorbance aga<strong>in</strong>st wavelength<br />
(nm) <strong>in</strong> the UV and visible section <strong>of</strong> the electromagnetic<br />
spectrum. (Note: absorbance does not have any units).<br />
Copyright © 2009 <strong>Royal</strong> <strong>Society</strong> <strong>of</strong> <strong>Chemistry</strong> www.rsc.org